 English
  Русский
 Bahasa Indonesia
 Bahasa Malay
 ไทย
ไทย Español
 Deutsch
 Български
 Français
 Tiếng Việt
 中文
中文 বাংলা
বাংলা हिन्दी
 Čeština
 Українська
 Română

The pair managed to break above the resistance zone of 1.3027 and it seems the target is now placed around 1.3106. However, as GBP/USD remains well consolidated above the 200 SMA at H1 chart, we can expect further strength and the 1.3100 psychological level could be a feasible objective. To the downside, the nearest support lies at 1.2968.
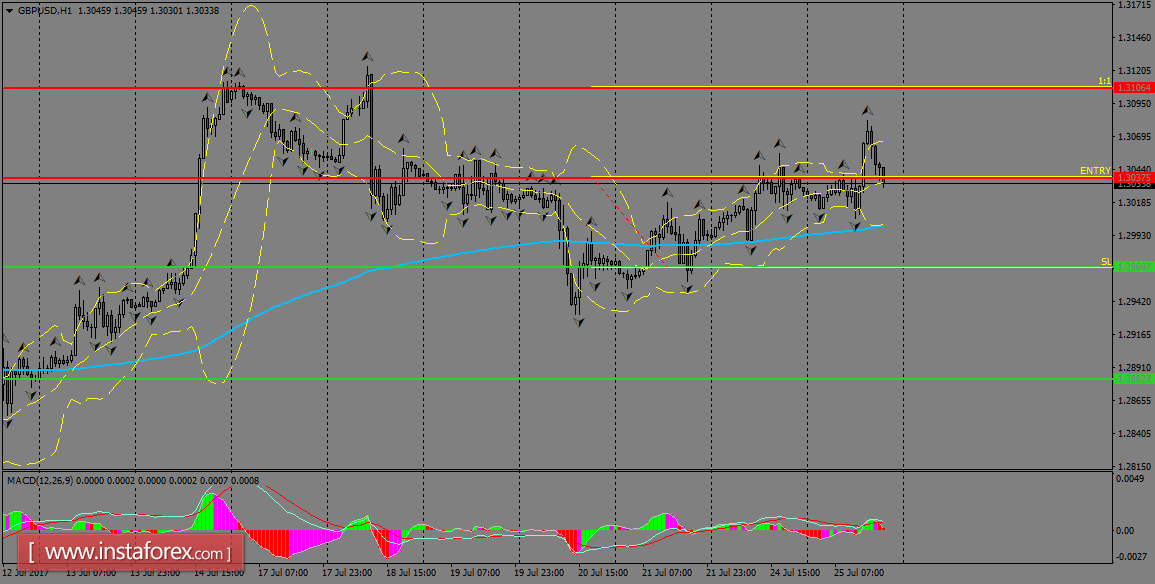
H1 chart's resistance levels: 1.3037 / 1.3106
H1 chart's support levels: 1.2968 / 1.2882
Trading recommendations for today: Based on the H1 chart, buy (long) orders only if the GBP/USD pair breaks a bullish candlestick; the resistance level is at 1.3037, take profit is at 1.3106 and stop loss is at 1.2968.