 English
  Русский
 Bahasa Indonesia
 Bahasa Malay
 ไทย
ไทย Español
 Deutsch
 Български
 Français
 Tiếng Việt
 中文
中文 বাংলা
বাংলা हिन्दी
 Čeština
 Українська
 Română

USDX is approaching the 200 SMA at H1 chart, where a bearish momentum could be gained in order to test levels below the psychological zone of 94.00. As long as the greenback stays below that moving average, we can expect weakness towards the support level of 93.29. To the upside, the nearest target lies at 94.85.
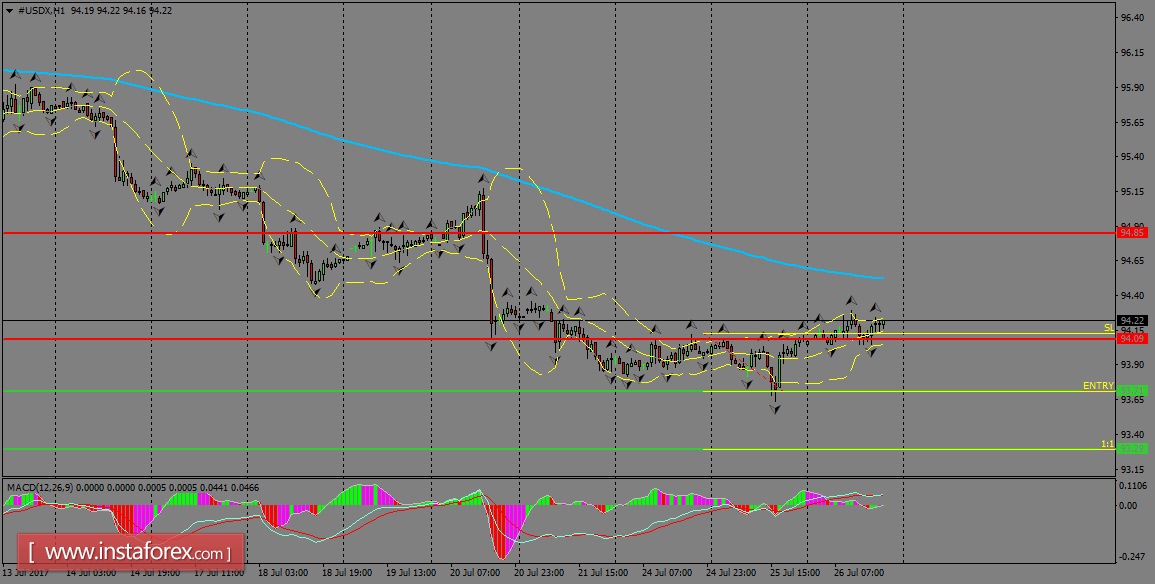
H1 chart's resistance levels: 94.09 / 94.88
H1 chart's support levels: 93.71 / 93.29
Trading recommendations for today: Based on the H1 chart, place sell (short) orders only if the USD Index breaks with a bearish candlestick; the support level is at 93.71, take profit is at 93.29 and stop loss is at 94.12.