 English
  Русский
 Bahasa Indonesia
 Bahasa Malay
 ไทย
ไทย Español
 Deutsch
 Български
 Français
 Tiếng Việt
 中文
中文 বাংলা
বাংলা हिन्दी
 Čeština
 Українська
 Română

The index recovered from the losses following the Fed's decision to keep rates unchanged at its July's meeting. The resistance zone of 94.09 is still capping further gains in USDX and if the index manages to break above that level, it can rally to 94.85 in a first degree. The MACD indicator is still in the positive territory, but is entering the overbought territory.
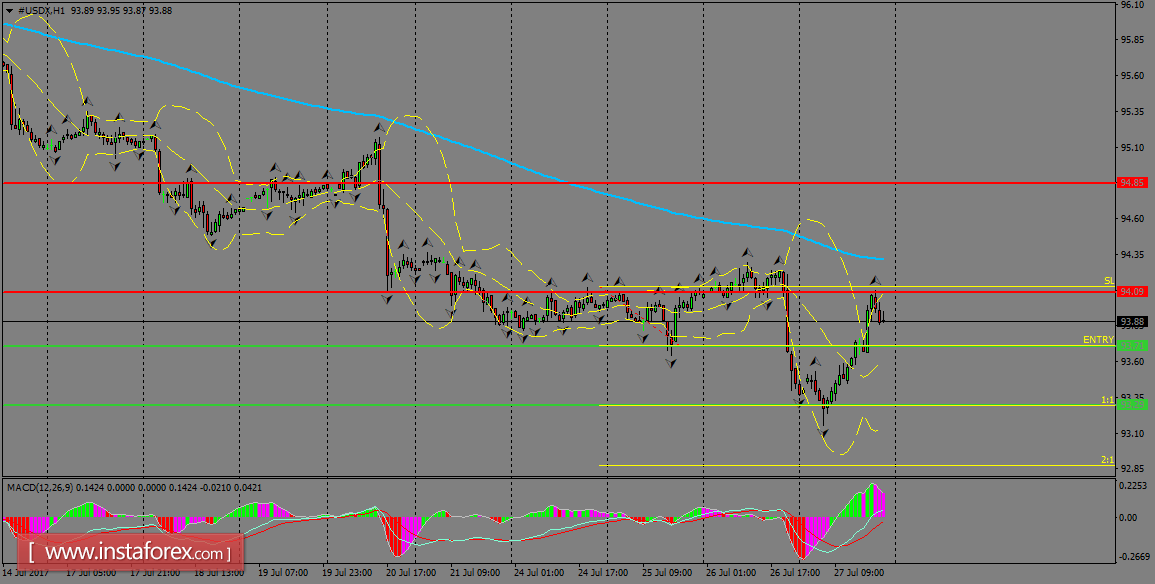
H1 chart's resistance levels: 94.09 / 94.88
H1 chart's support levels: 93.71 / 93.29
Trading recommendations for today: Based on the H1 chart, place sell (short) orders only if the USD Index breaks with a bearish candlestick. The support level is at 93.71, take profit is at 93.29 and stop loss is at 94.12.