 English
  Русский
 Bahasa Indonesia
 Bahasa Malay
 ไทย
ไทย Español
 Deutsch
 Български
 Français
 Tiếng Việt
 中文
中文 বাংলা
বাংলা हिन्दी
 Čeština
 Українська
 Română

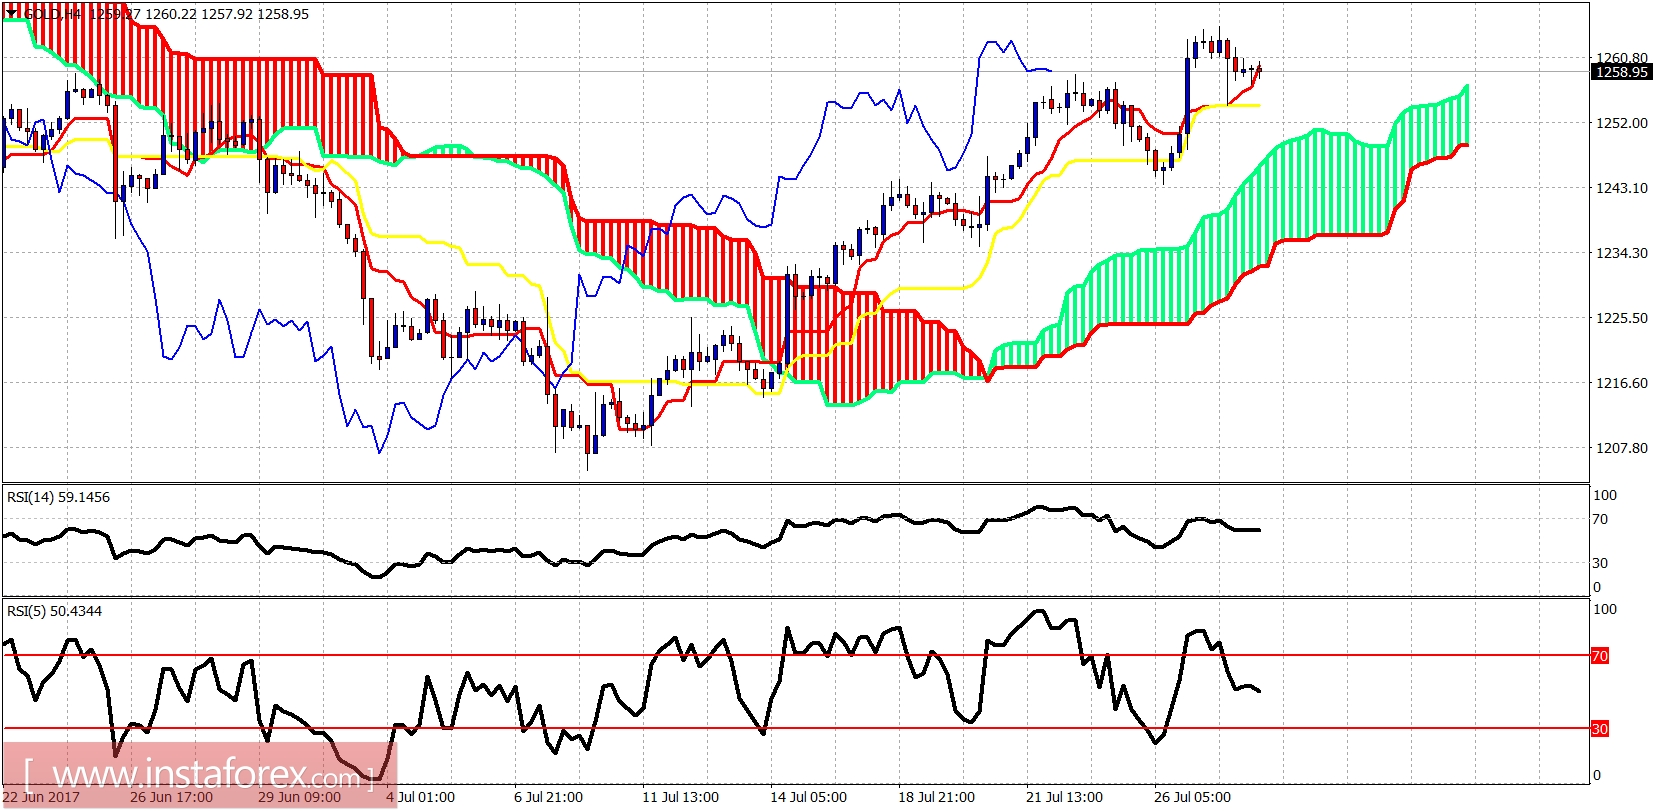
The Gold price made a new higher high yesterday and remains in a bullish trend. The Gold price is breaking above the $1,250-60 resistance area and is heading towards the long-term resistance at $1,280-90.
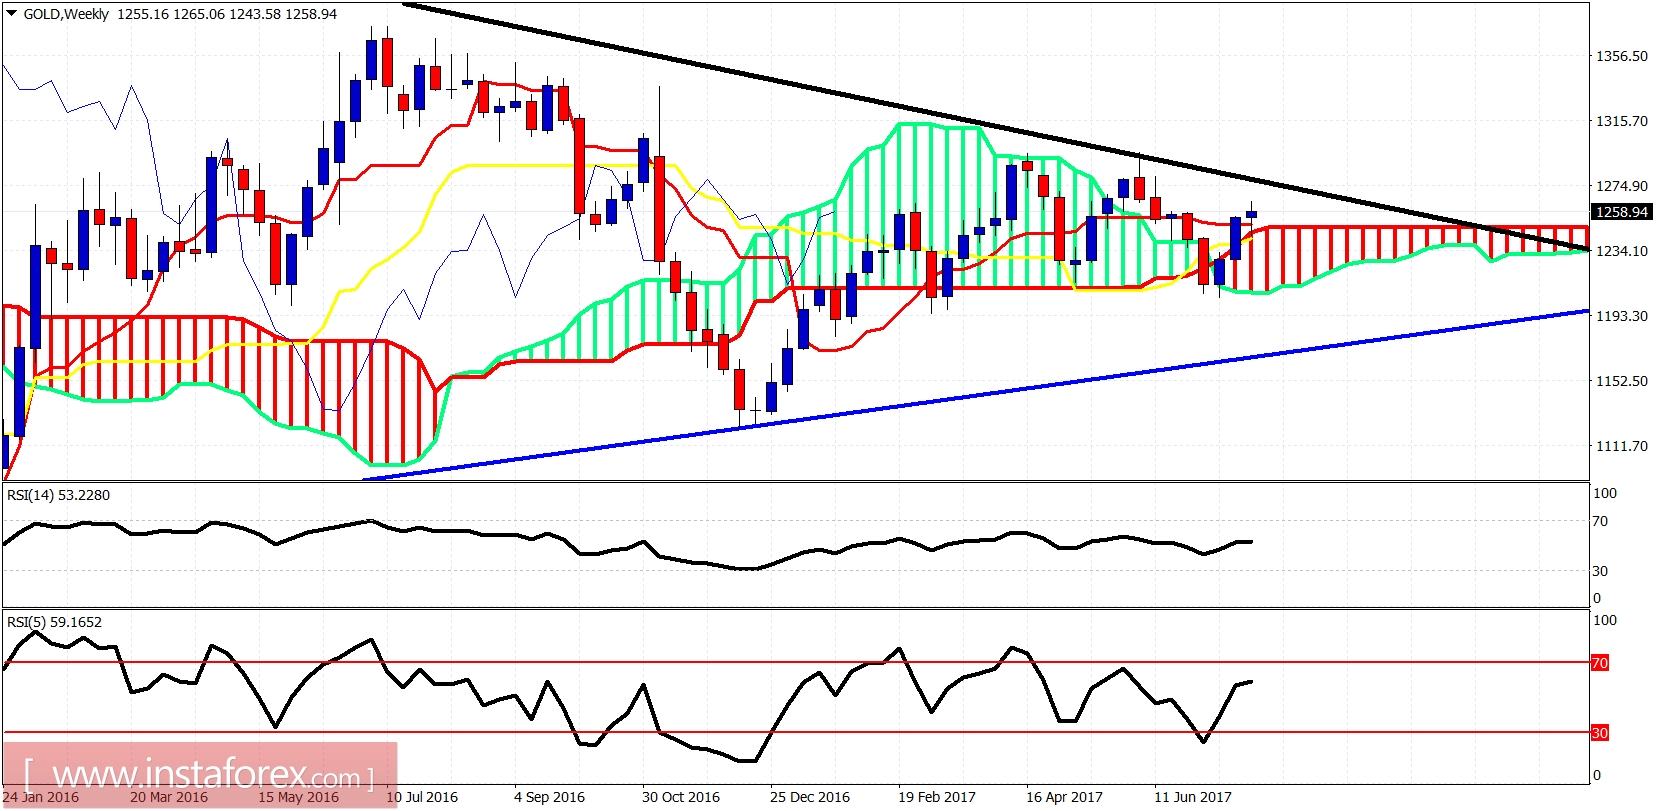
Black line - long-term resistance
Long-term resistance trend line from the ATH is at $1,275-80. The Gold price has not managed to break it every time it tried since November 2015 when medium-term trend changed. A rejection at $1,275 will push the price back towards the weekly Kumo at $1,250-40. If a cloud is broken we should expect the Gold price to test the blue trend line. I remain long-term bullish.