 English
  Русский
 Bahasa Indonesia
 Bahasa Malay
 ไทย
ไทย Español
 Deutsch
 Български
 Français
 Tiếng Việt
 中文
中文 বাংলা
বাংলা हिन्दी
 Čeština
 Українська
 Română

The USDX is still below the 200 SMA in the H1 chart and it is forming a possible double bottom around the 93.25 level. THe weakness is limited and we can expect some consolidation moves in the first days of the week. However, if the 93.25 level gives up, further declines are expected to happen towards 92.29 level.
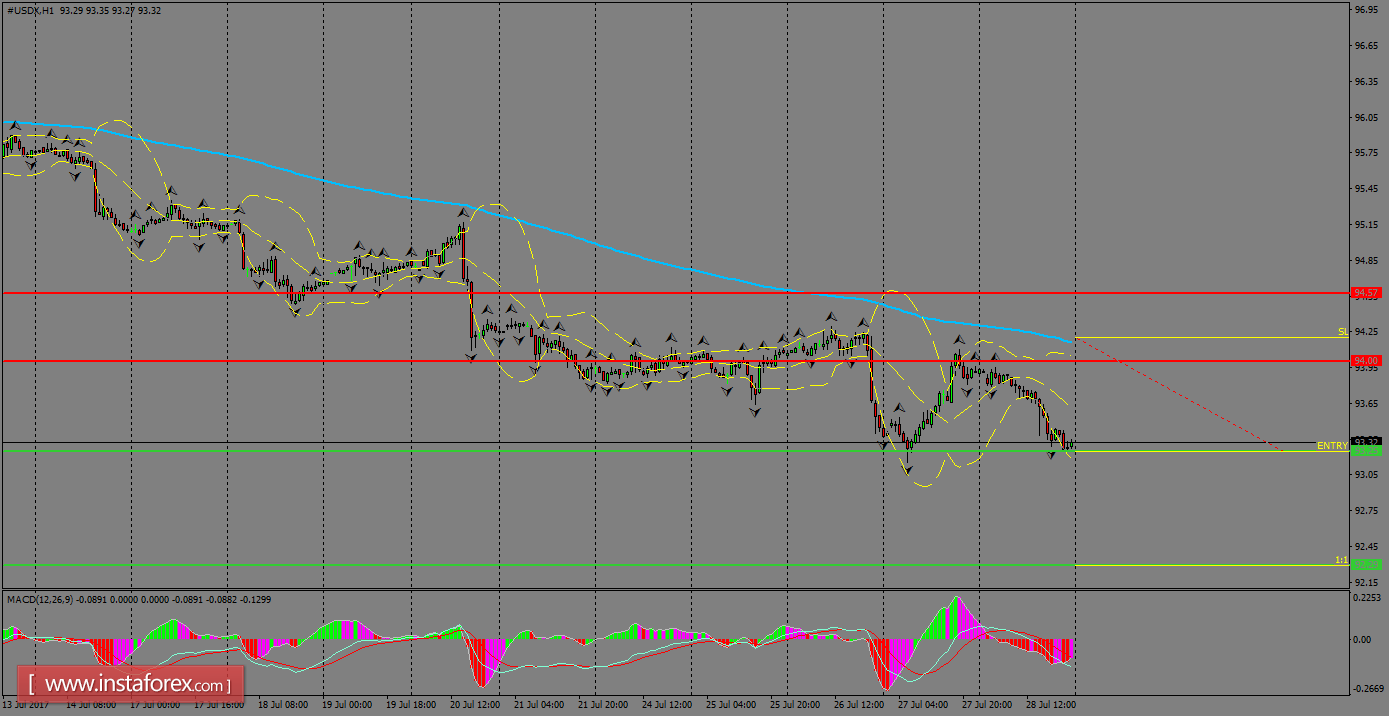
H1 chart's resistance levels: 94.00 / 94.57
H1 chart's support levels: 93.25 / 92.29
Trading recommendations for today: Based on the H1 chart, place sell (short) orders only if the USD index breaks with a bearish candlestick; the support level is at 93.25, take profit is at 92.29 and stop loss is at 94.20.