 English
  Русский
 Bahasa Indonesia
 Bahasa Malay
 ไทย
ไทย Español
 Deutsch
 Български
 Français
 Tiếng Việt
 中文
中文 বাংলা
বাংলা हिन्दी
 Čeština
 Українська
 Română

The US dollar index remains in a bearish trend as the price continues to make lower lows and lower highs. The index remains trapped inside a bearish channel but we have reached the important long-term support levels.
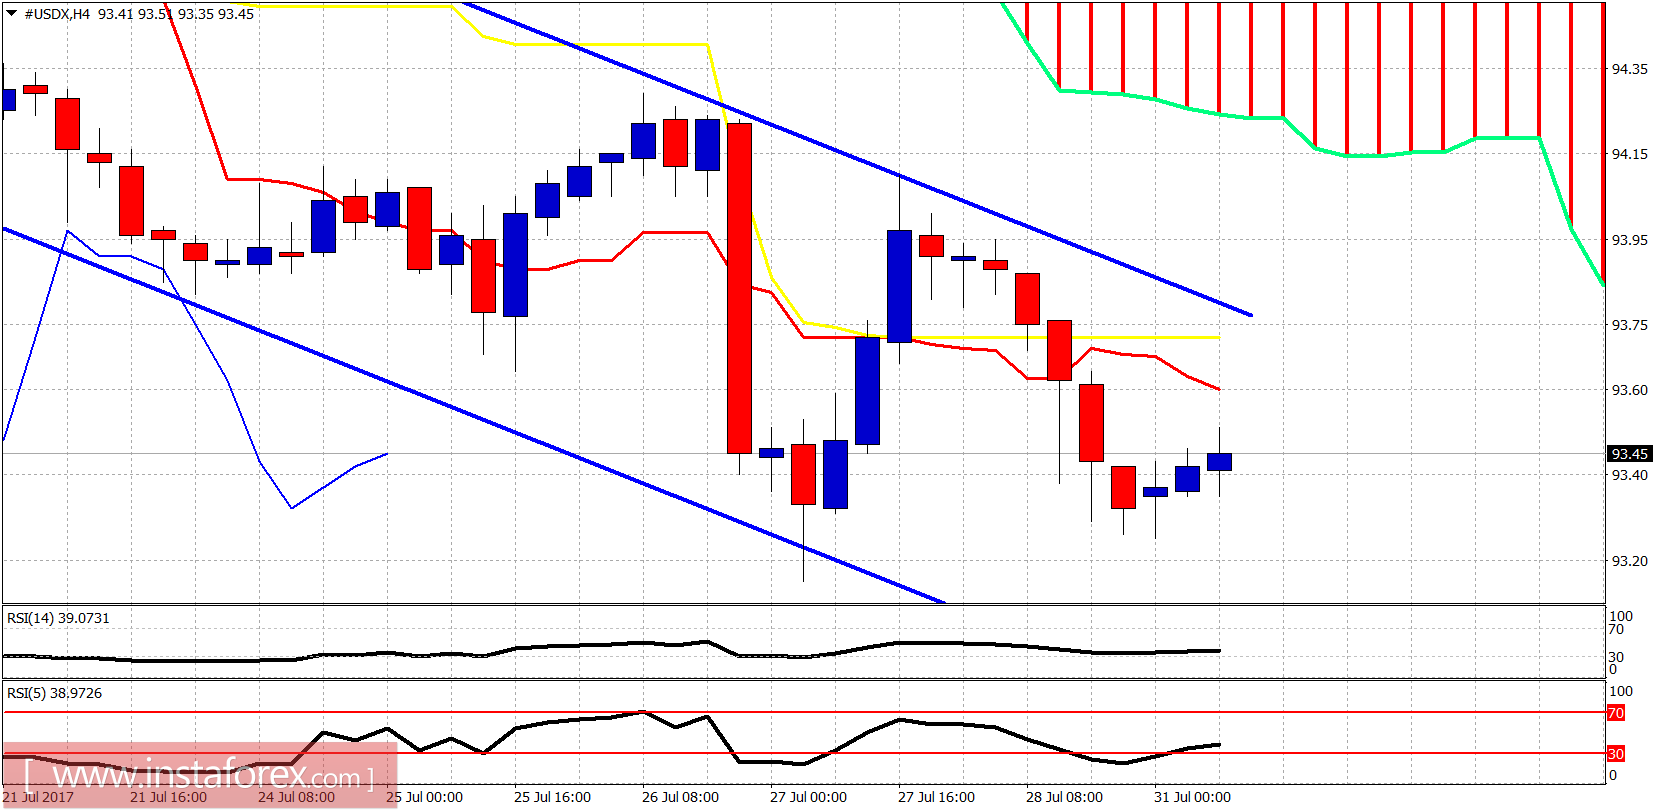
The short-term resistance lies at 93.75-93.85 area. The support is found at 93.30. Breaking above resistance will open the way to a bigger bounce towards the cloud resistance at 94.20-94.50. Breaking support will open the way to a push lower towards 92.
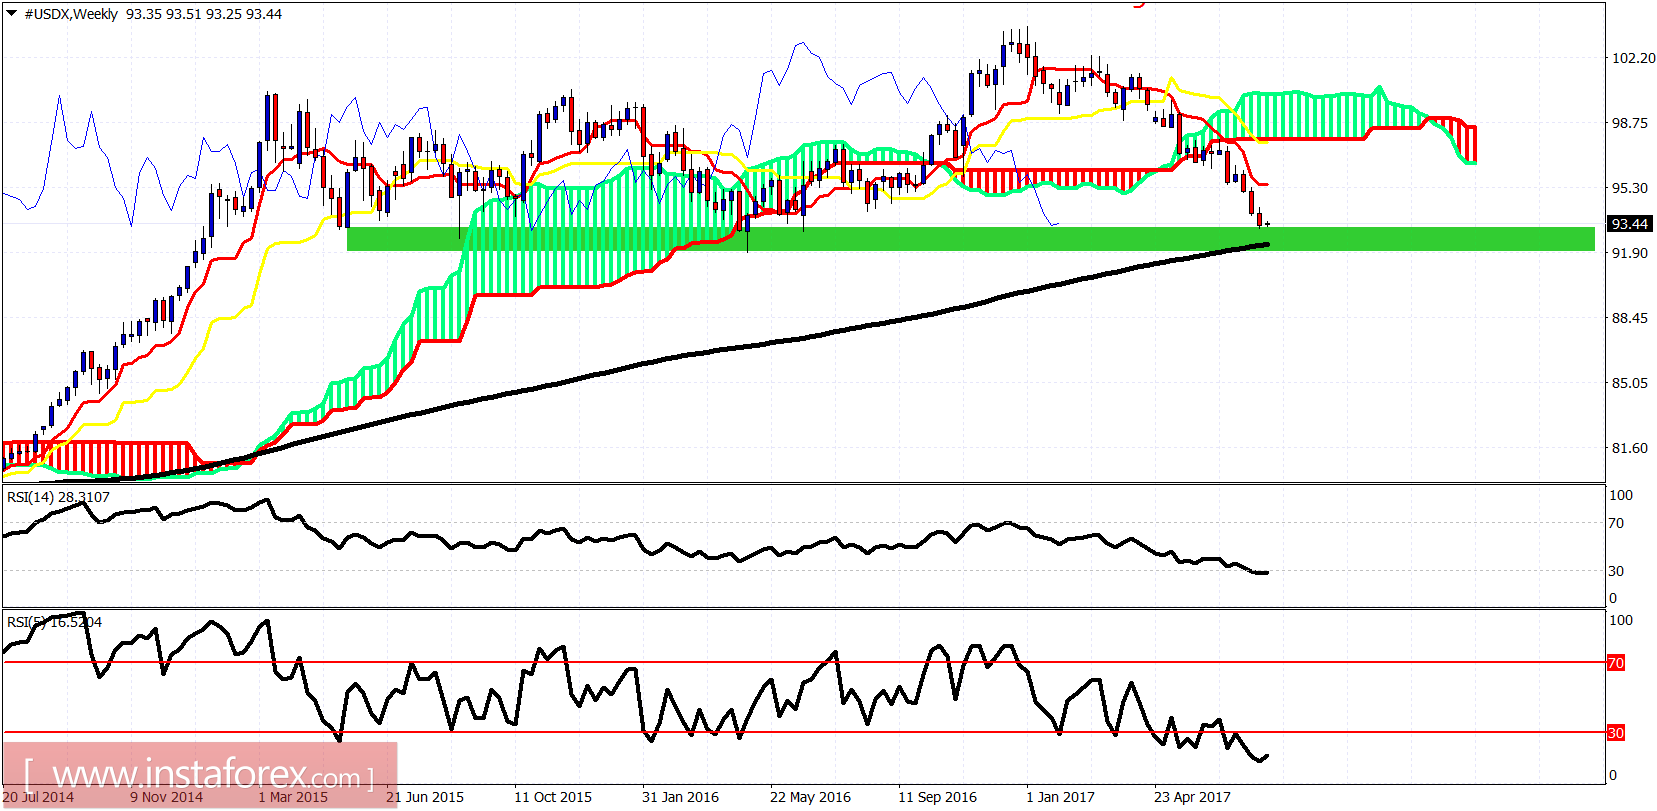
The price is approaching the weekly 200 MA and the support area of 92-93. The trend is clearly bearish. A reversal from current levels in short-term trend could result in a bounce towards 95.50 which is our minimum bounce target.