The NZD/USD has given a reversal signal yesterday and early today is approaching its first minimum pull back target at 0.74. Short-term trend is bearish as long as the price is below 0.7525.
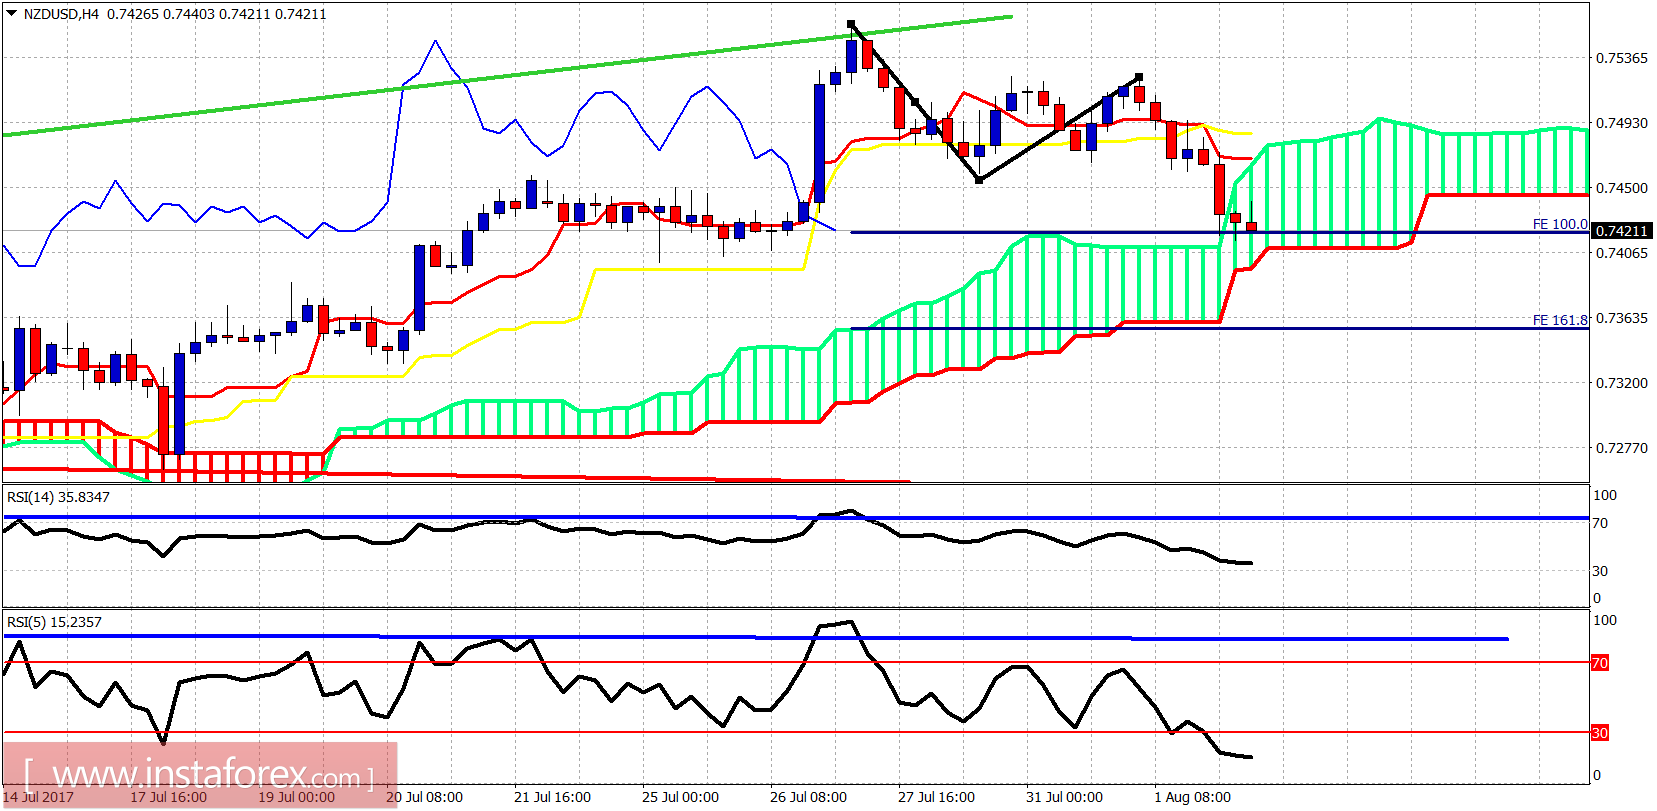
The second leg down is approaching equality with the first leg down. At 0.7405 we also get the lower cloud boundary and short-term support. A break below these levels will open the way for an extended downward move equal to 161.8% of the first leg down.
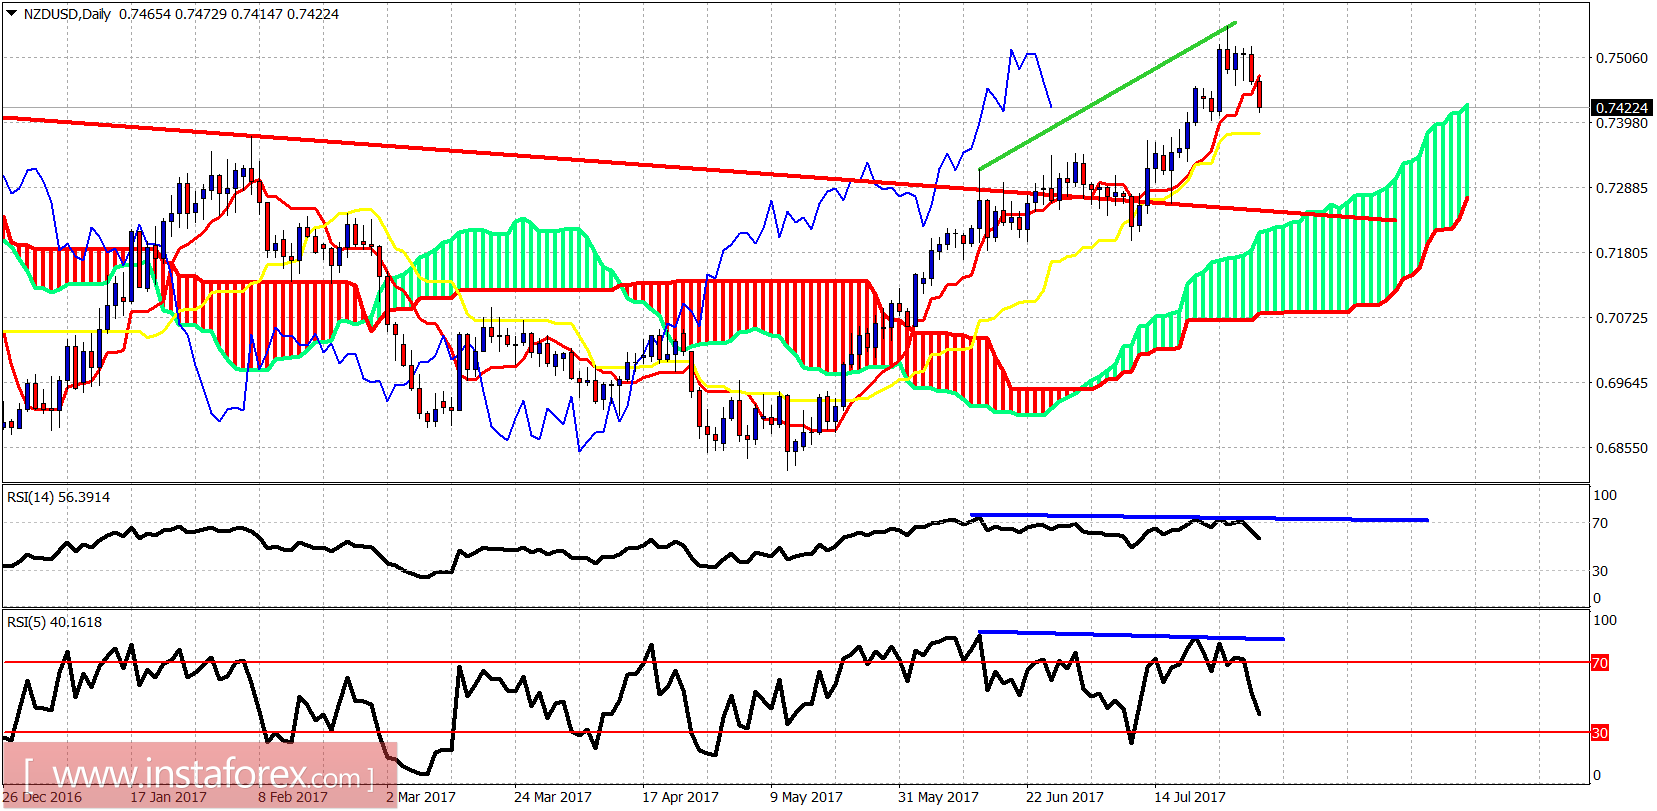
On a daily basis, the price has broken below the tenkan-sen (red line indicator). This is a bearish signal. The RSI is diverging so I would expect the price to move towards the kijun-sen (yellow line indicator). If this support is broken we should expect more selling pressures to push price towards the daily cloud around 0.7250-0.73.
*The market analysis posted here is meant to increase your awareness, but not to give instructions to make a trade
 English
  Русский
 Bahasa Indonesia
 Bahasa Malay
 ไทย
ไทย Español
 Deutsch
 Български
 Français
 Tiếng Việt
 中文
中文 বাংলা
বাংলা हिन्दी
 Čeština
 Українська
 Română
 Long-term review