 English
  Русский
 Bahasa Indonesia
 Bahasa Malay
 ไทย
ไทย Español
 Deutsch
 Български
 Français
 Tiếng Việt
 中文
中文 বাংলা
বাংলা हिन्दी
 Čeština
 Українська
 Română

The Dollar index made a new lower low yesterday. The trend remains bearish. There are important bullish divergence signals by the RSI. This is a warning for Dollar bears.
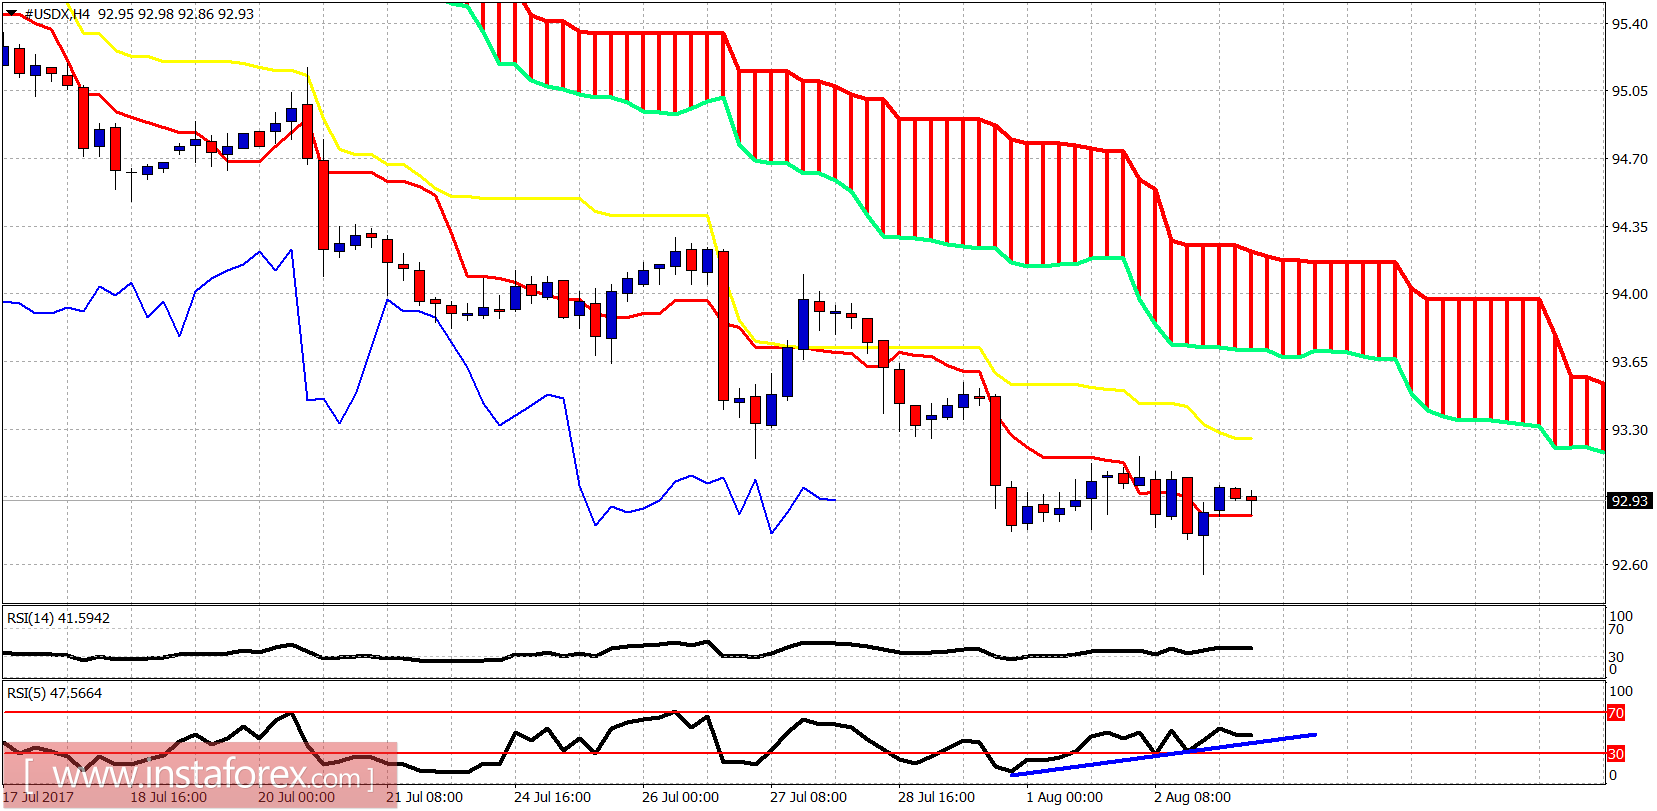
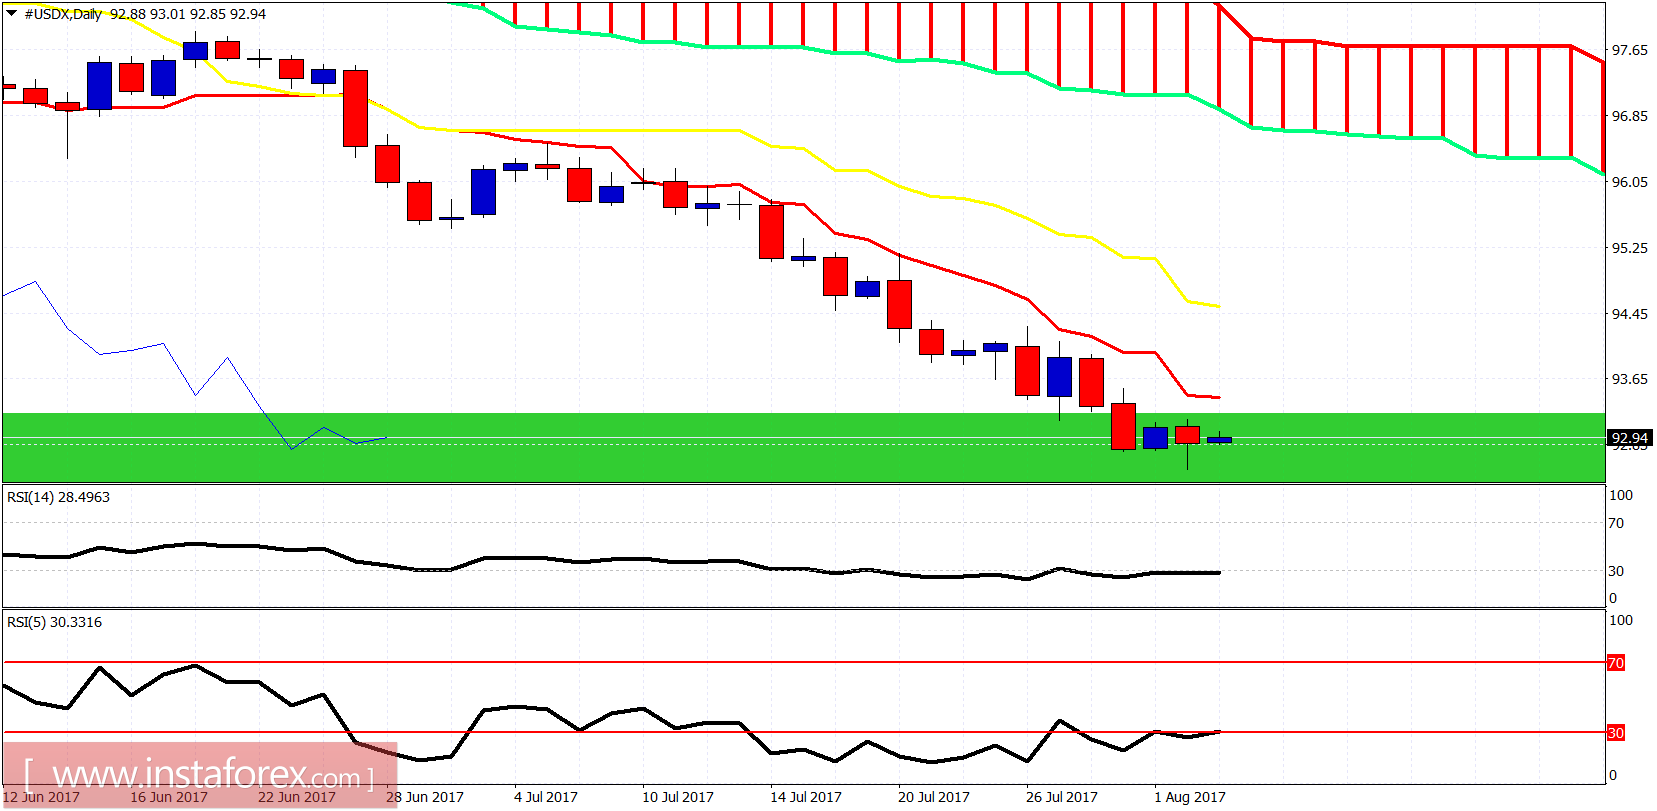
The Dollar index as we mentioned in previous posts, is trading inside the long-term support area of 92-93. Combined with the bullish divergence signs in the daily and 4-hour chart, we should expect a strong bounce at least towards 94.50 if not higher towards the Daily cloud resistance at 96.