English
  Русский
 Bahasa Indonesia
 Bahasa Malay
 ไทย
ไทย Español
 Deutsch
 Български
 Français
 Tiếng Việt
 中文
中文 বাংলা
বাংলা हिन्दी
 Čeština
 Українська
 Română

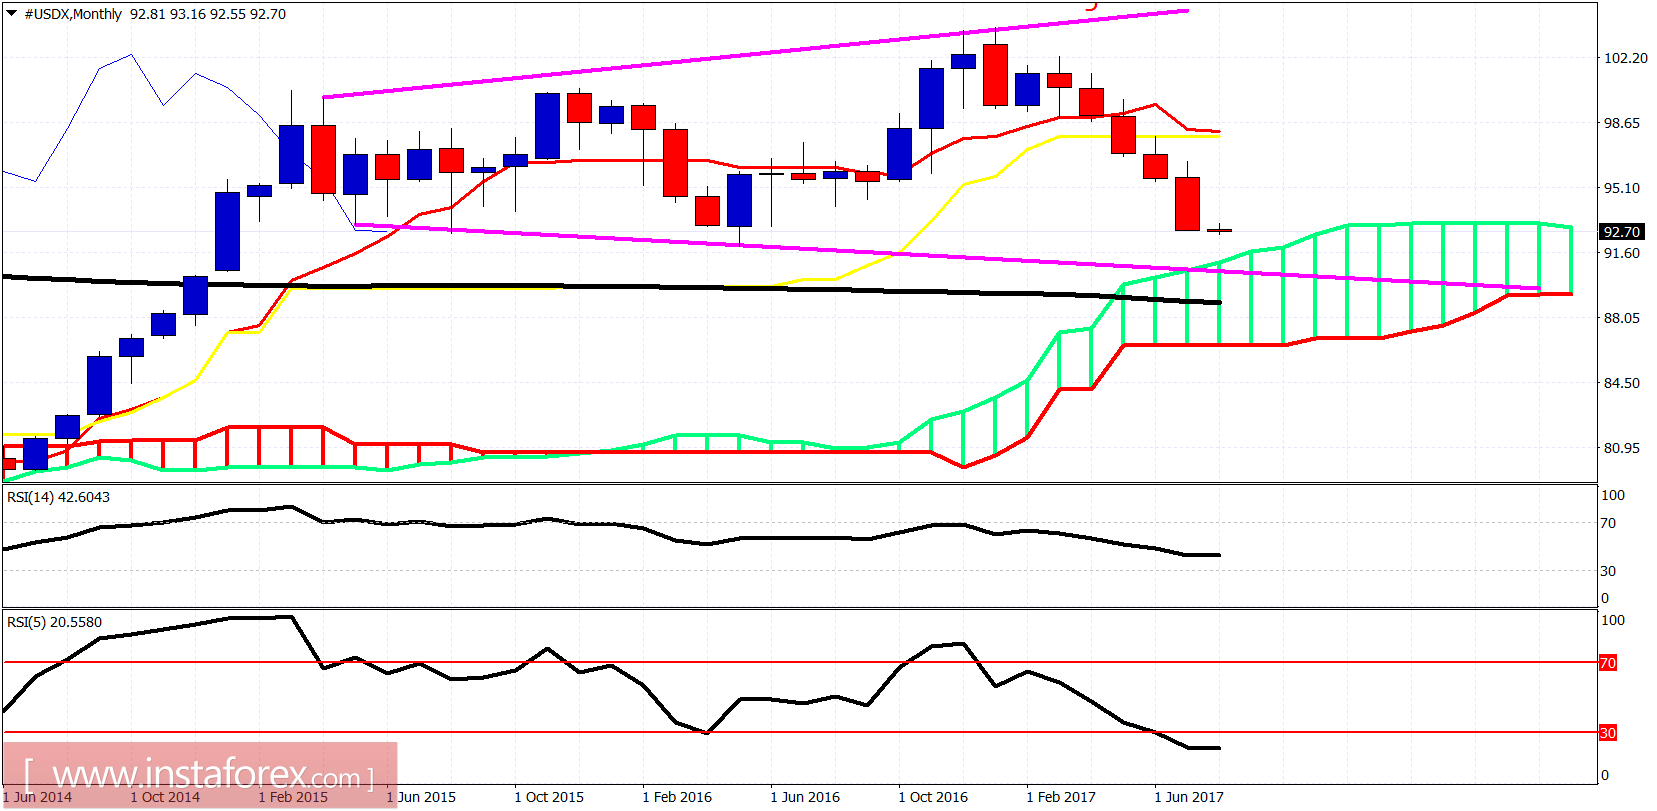
The US dollar index is near its yearly lows and inside the weekly support area of 93-92. The trend remains bearish. The key reversal level in the short term lies at 93. Oscillators are diverging, warning us of a strong bounce. Will the NFP provide the causation?
Magenda line - resistance
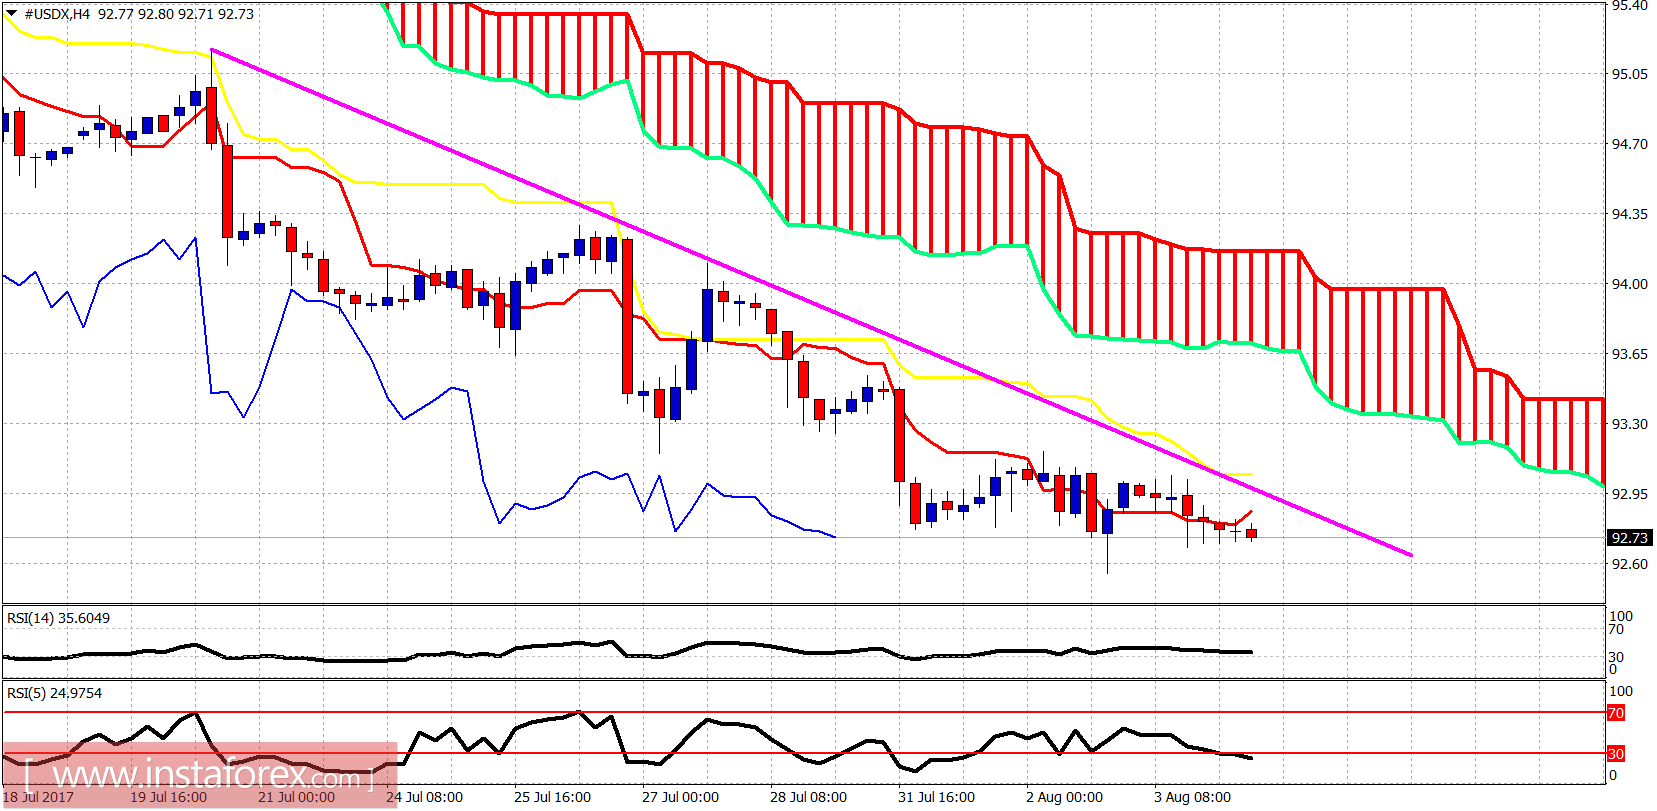
The dollar index is trading below both the tenkan- and kijun-sen indicators as well as below the downward sloping trend line. Resistance is at 93-93.15. The short-term support is found at 92.50.