 English
  Русский
 Bahasa Indonesia
 Bahasa Malay
 ไทย
ไทย Español
 Deutsch
 Български
 Français
 Tiếng Việt
 中文
中文 বাংলা
বাংলা हिन्दी
 Čeština
 Українська
 Română
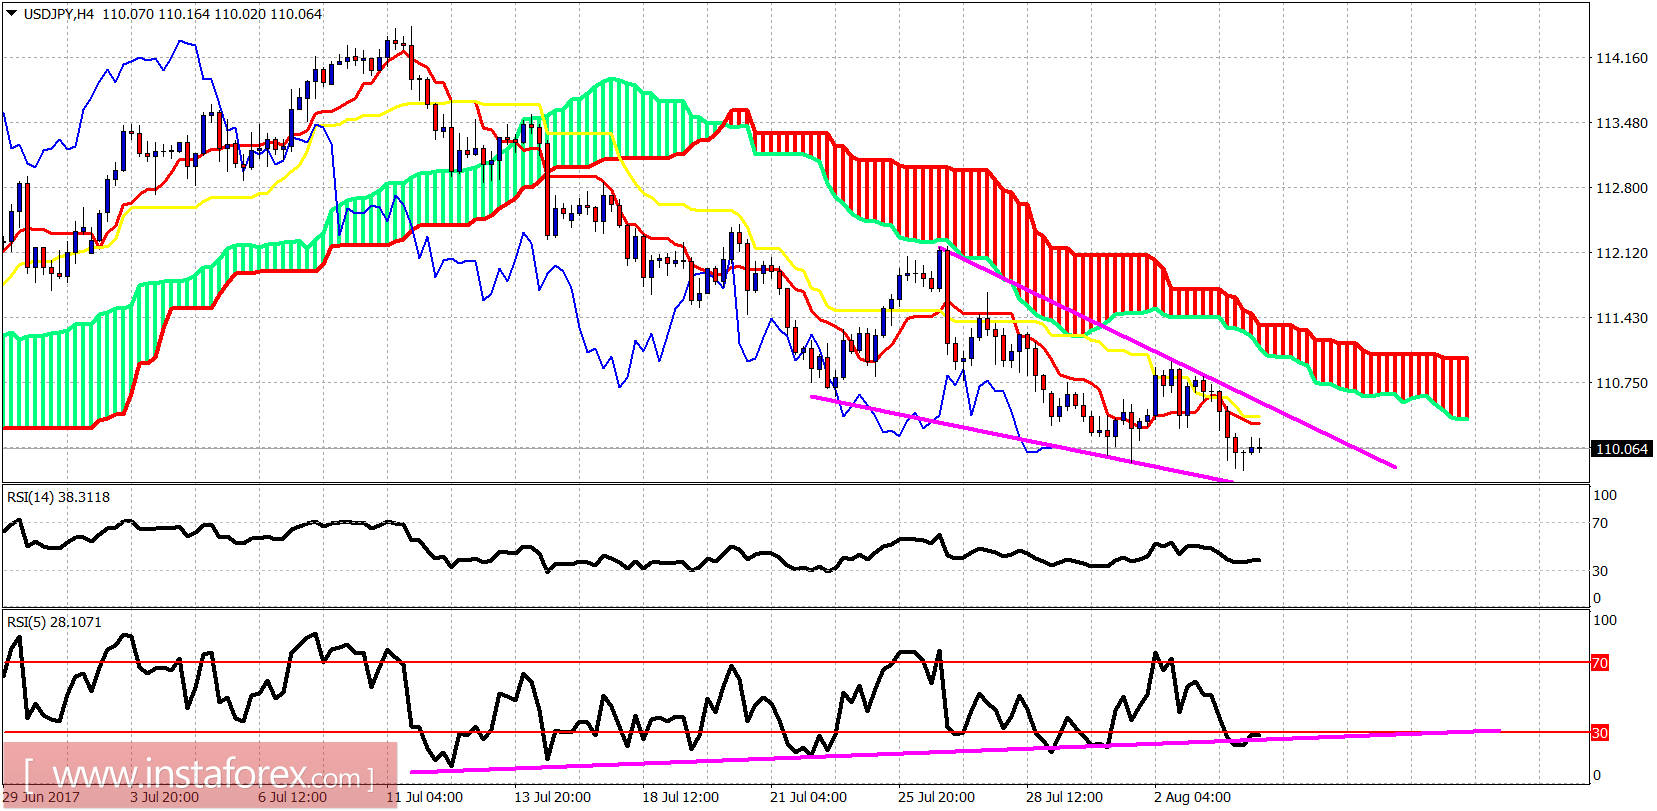
There are important bullish divergence signs in the short- and medium-term. A downward sloping wedge pattern also suggests that soon the downward move from 112.15 will be over and a bounce will come with 111 as first target and 112 as next.
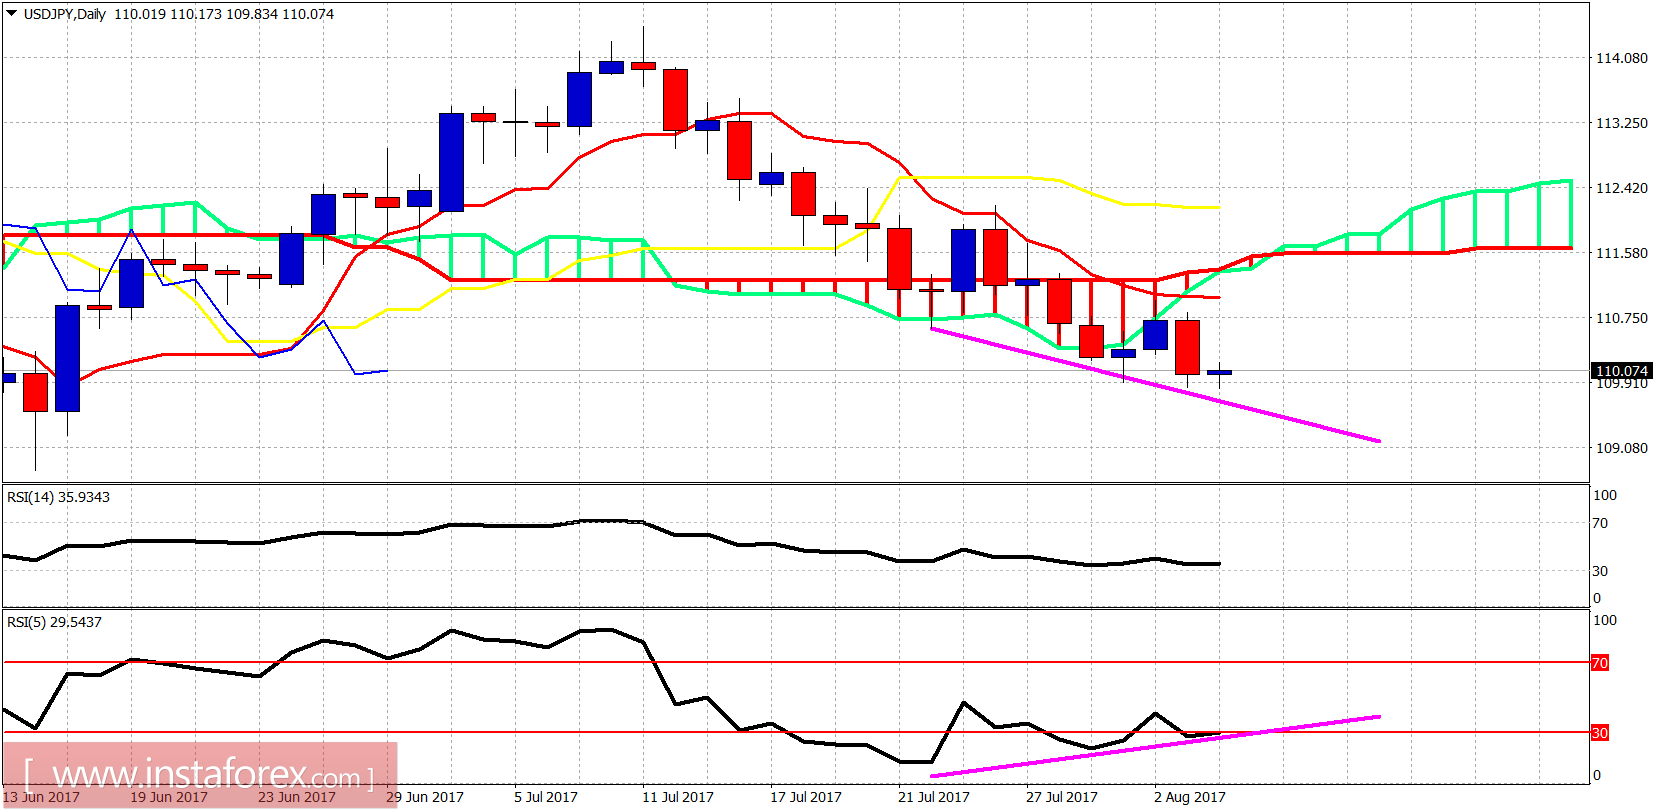
 Long-term review
There are important bullish divergence signs in the short- and medium-term. A downward sloping wedge pattern also suggests that soon the downward move from 112.15 will be over and a bounce will come with 111 as first target and 112 as next.