English
  Русский
 Bahasa Indonesia
 Bahasa Malay
 ไทย
ไทย Español
 Deutsch
 Български
 Français
 Tiếng Việt
 中文
中文 বাংলা
বাংলা हिन्दी
 Čeština
 Українська
 Română

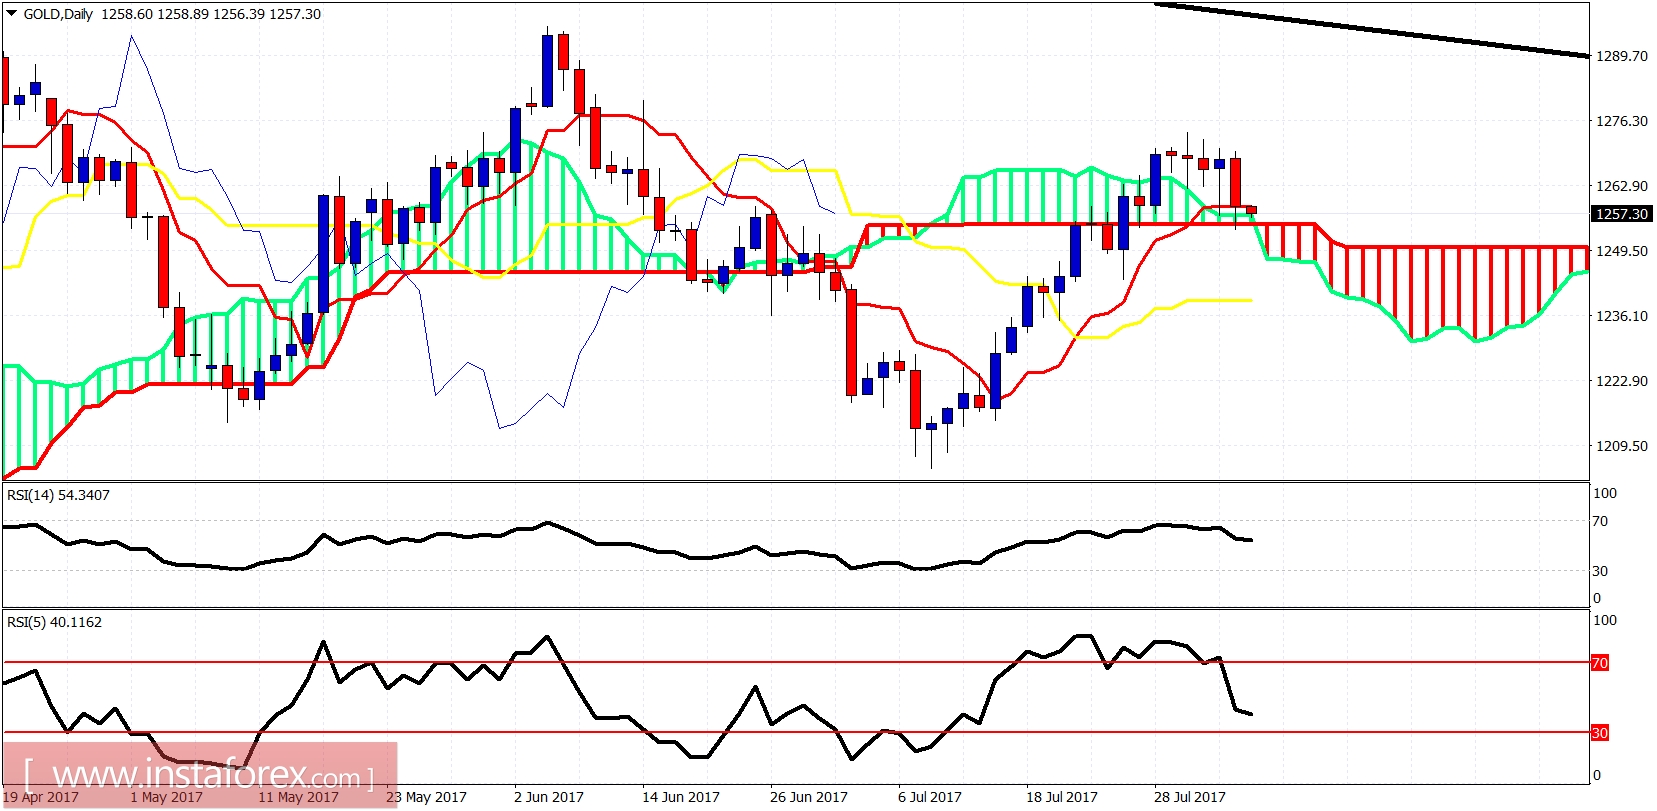
The Gold price has broken the bullish channel downwards and has started a corrective phase. Price is expected to pull back at least towards $1,248. Short-term trend is bearish. I expect the corrective phase to last at least this week.
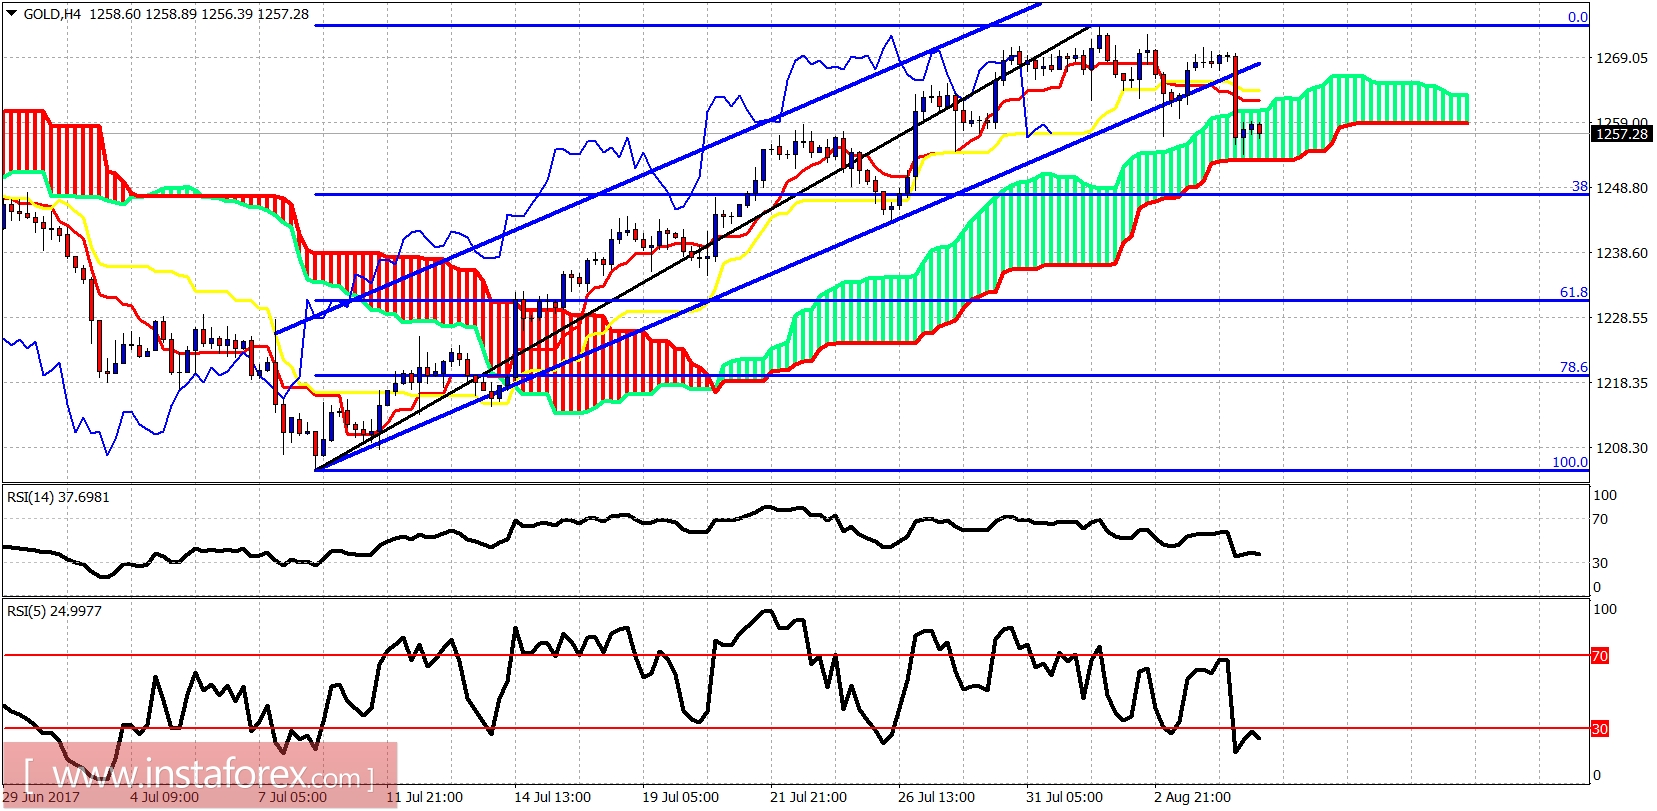
The Gold price is trading inside the 4 hour Kumo. The trend has changed from bullish to neutral in cloud terms, but technically it is bearish for the short-term as we are now making lower lows and lower highs, having broken the bullish channel. Support is at $1,248 at the 38% Fibonacci retracement.