 English
  Русский
 Bahasa Indonesia
 Bahasa Malay
 ไทย
ไทย Español
 Deutsch
 Български
 Français
 Tiếng Việt
 中文
中文 বাংলা
বাংলা हिन्दी
 Čeština
 Українська
 Română

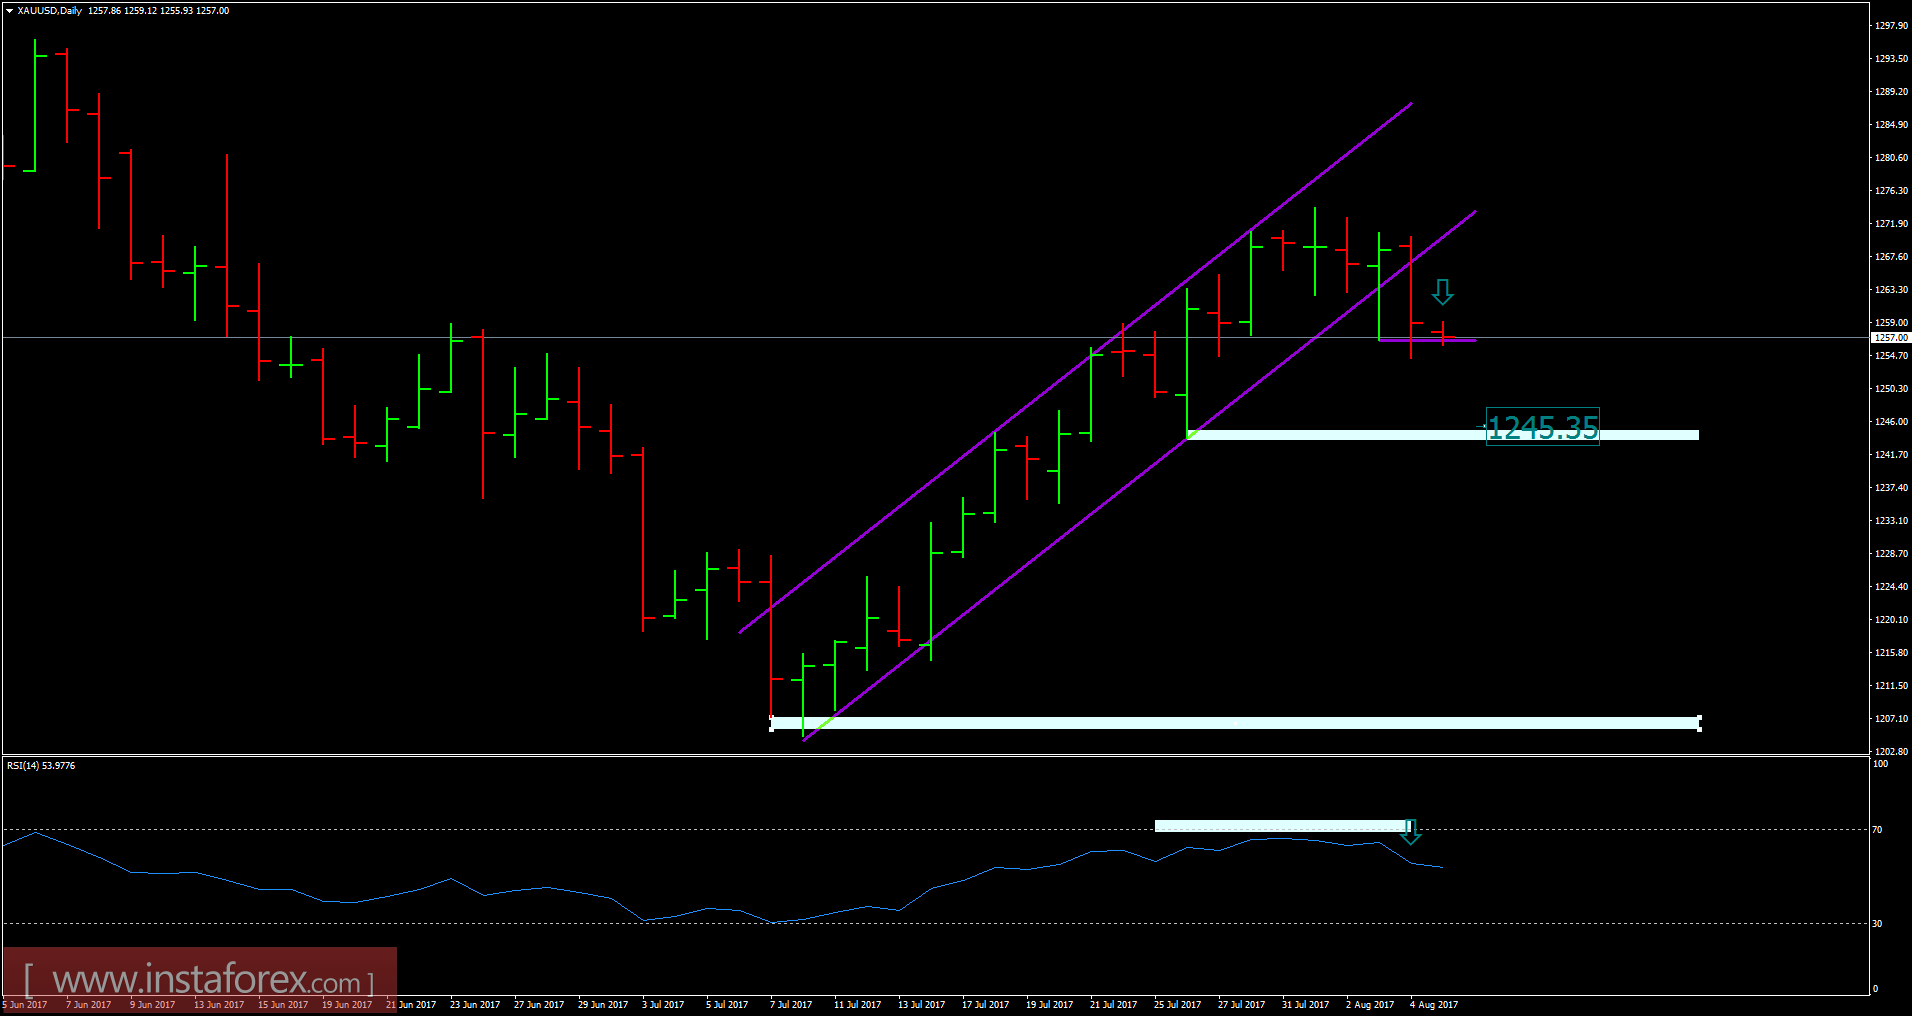
Recently, gold has been trading downwards. The price tested the level of $1,254.00. On the daily time frame, I found a broken upward channel, which is a sign that buying looks risky. Also, there is a bearish flip on RSI oscilator, which is another sign of weakness. My advice is to watch for potential selling opportunties. The first downward target is set at the price of $1,245.00.
Resistance levels:
R1: $1,263.00
R2: $1,265.00
R3: $1,266.00
Support levels:
S1: $1,261.00
S2: $1,260.00
S3: $1,259.00
Trading recommendations for today: watch for potential selling opportunities.