English
  Русский
 Bahasa Indonesia
 Bahasa Malay
 ไทย
ไทย Español
 Deutsch
 Български
 Français
 Tiếng Việt
 中文
中文 বাংলা
বাংলা हिन्दी
 Čeština
 Українська
 Română

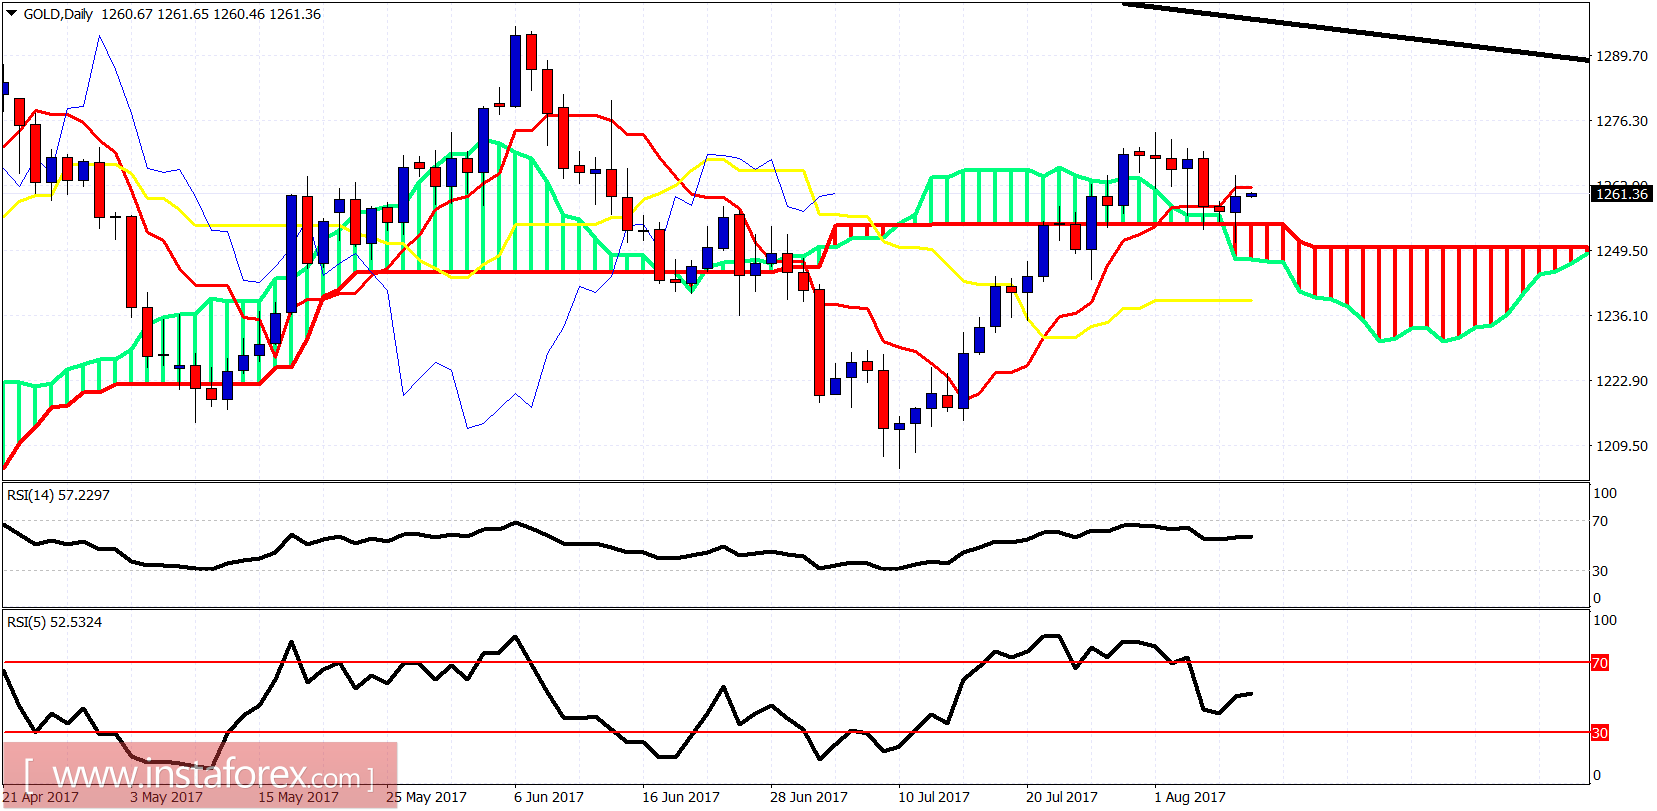
Gold price has reached very close to our minimum pull back to target and daily Kumo (cloud) support at $1,250 as expected and is bouncing. Price remains trapped inside the short-term bearish channel and short term trend remains neutral or slightly bearish. The longer-term view remains bullish.


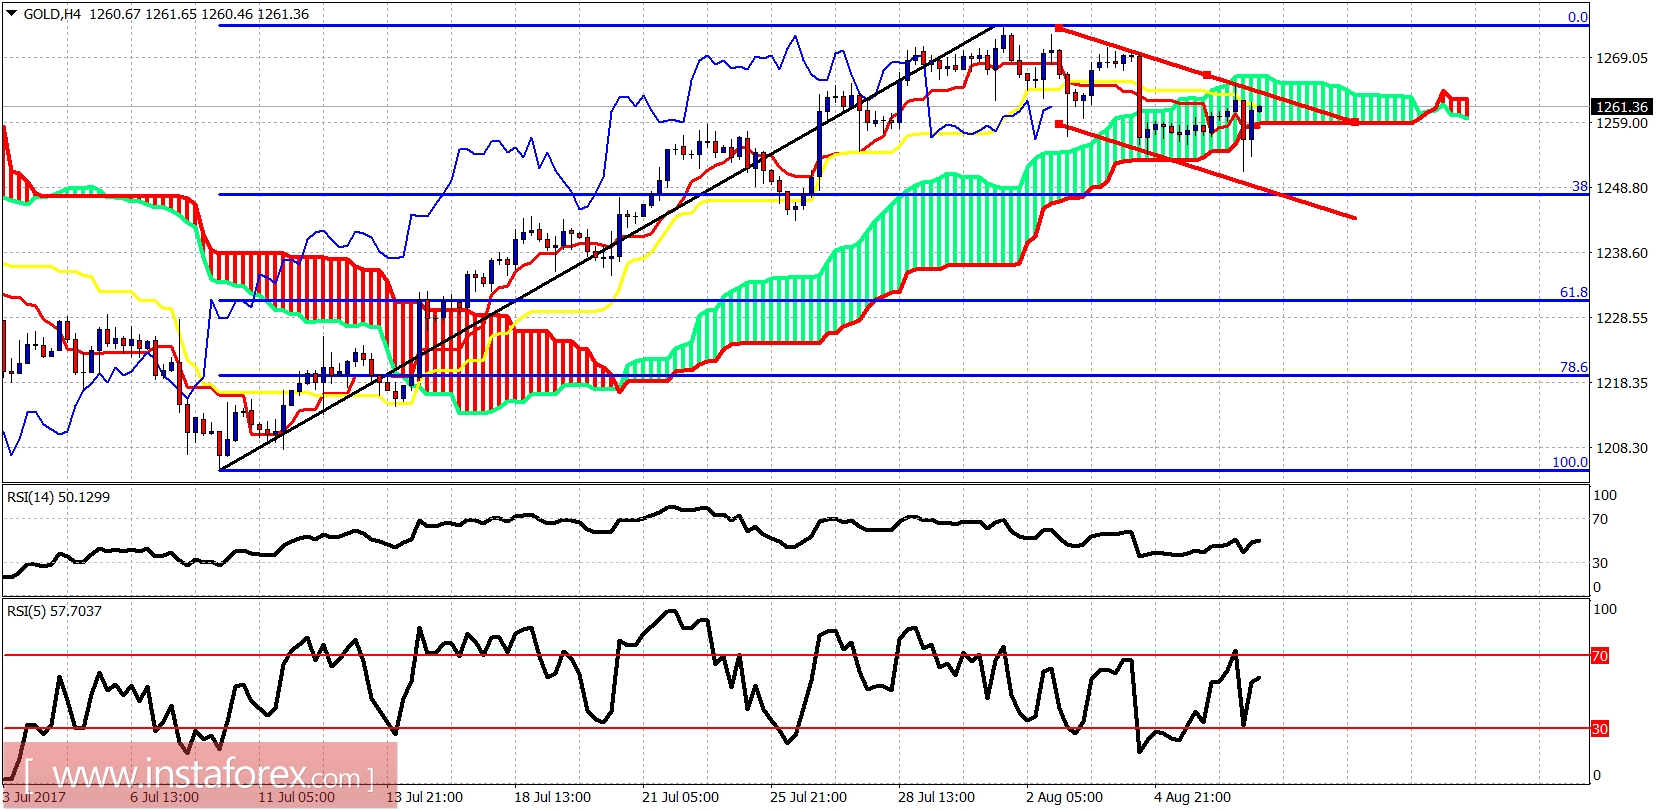
Red lines - bearish channel
Gold price is trading inside the Kumo. The trend is neutral. Short-term support is at $1,249 (38% Fibonacci retracement). Resistance is at $1,257.