English
  Русский
 Bahasa Indonesia
 Bahasa Malay
 ไทย
ไทย Español
 Deutsch
 Български
 Français
 Tiếng Việt
 中文
中文 বাংলা
বাংলা हिन्दी
 Čeština
 Українська
 Română

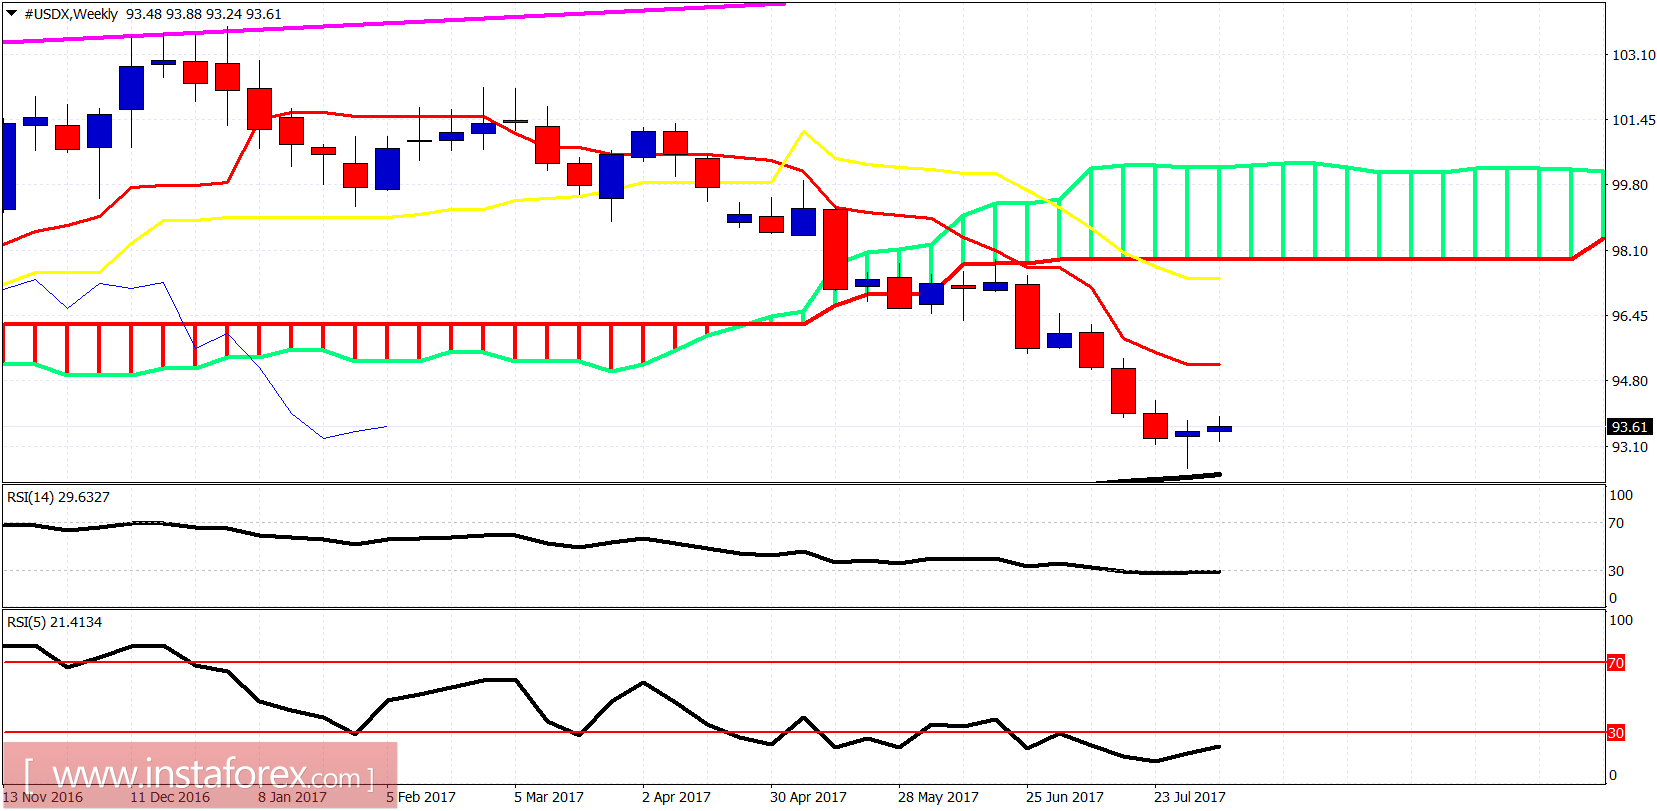
The Dollar index is in a process of reversing its medium-term bearish trend and is going to push to higher levels. Short-term trend has changed to bullish and I continue to believe that a strong Dollar bounce is what we currently see at its early stages.
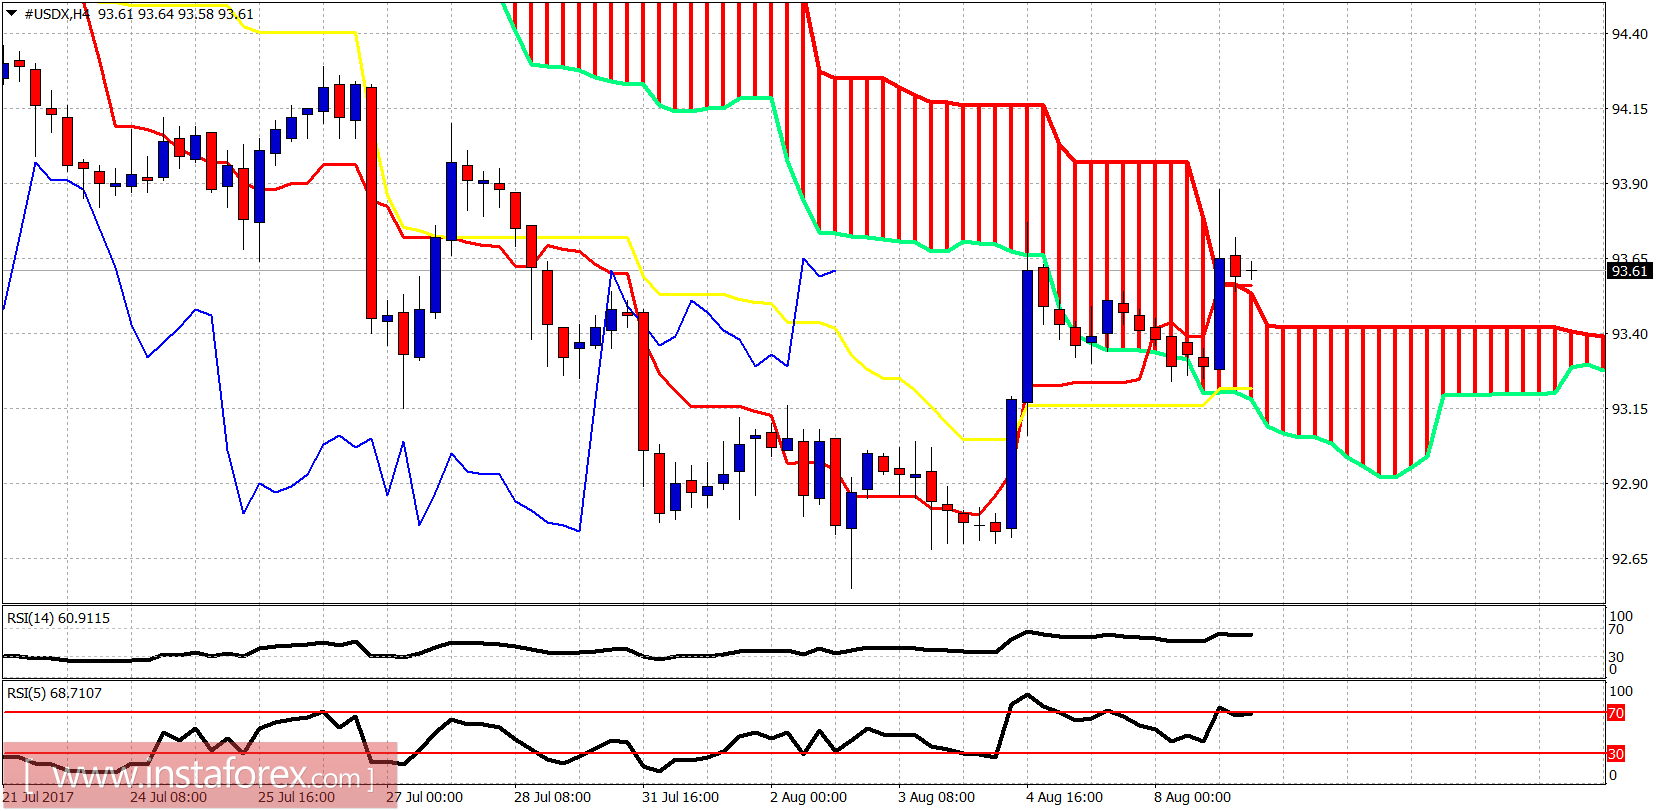
In the 4-hour chart, the Dollar index has broken out of the Ichimoku cloud. However strong resistance is found in the short-term at 93.80. Short-term support is at 93.20 where the kijun-sen is found. The trend is bullish as the price is making higher highs and higher lows.