 English
  Русский
 Bahasa Indonesia
 Bahasa Malay
 ไทย
ไทย Español
 Deutsch
 Български
 Français
 Tiếng Việt
 中文
中文 বাংলা
বাংলা हिन्दी
 Čeština
 Українська
 Română

The USD/CAD remains in a bullish trend since we last posted an analysis about it looking for 1.28. It looks highly possible to catch that price level soon.
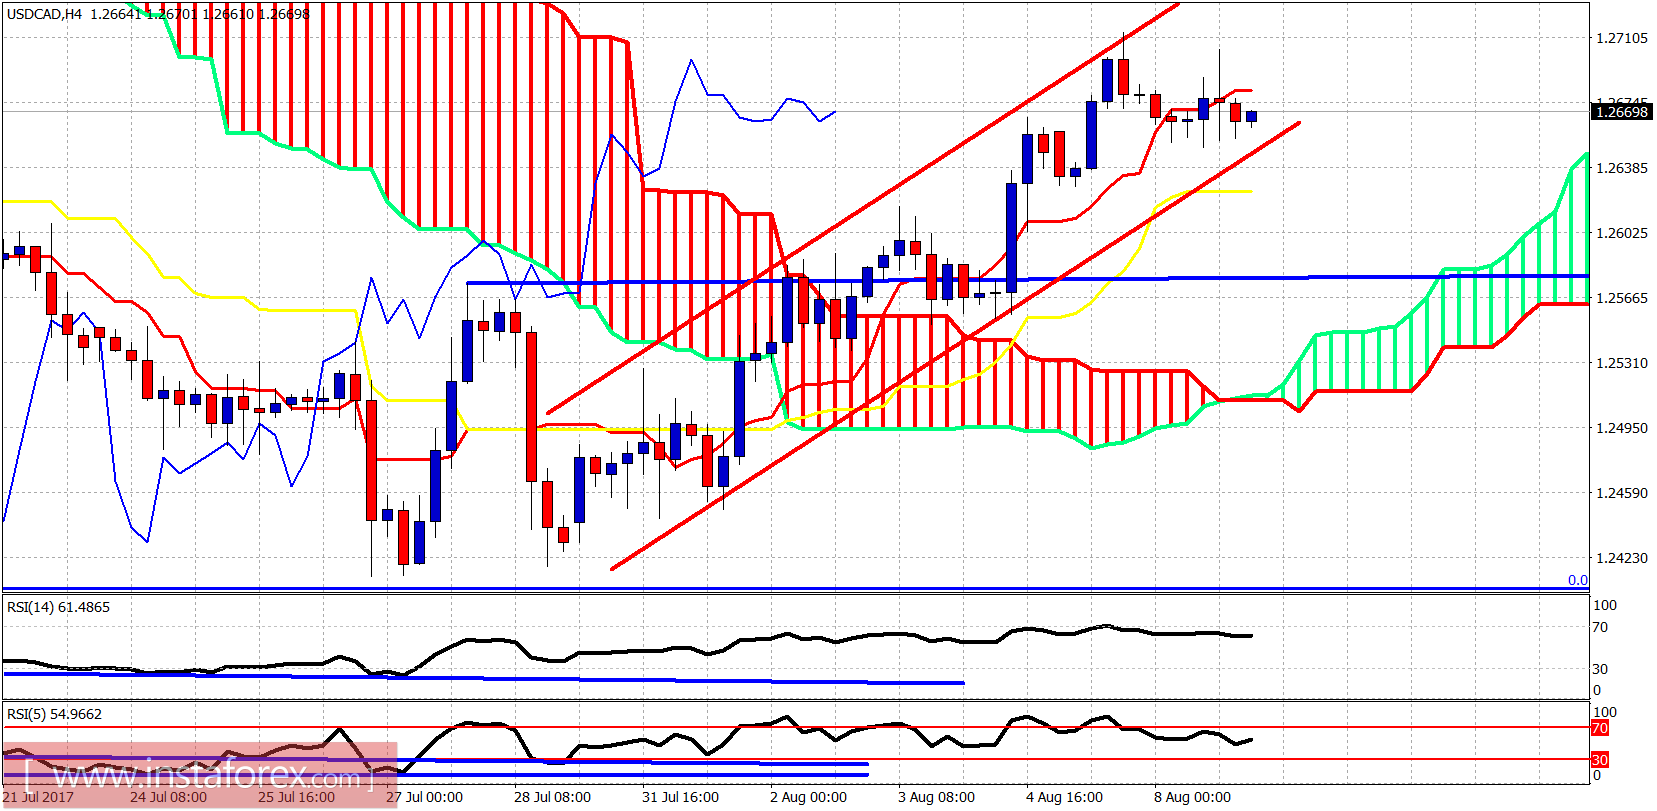
The USD/CAD is clearly in a bullish short-term trend. Price is above the cloud and inside the bullish channel where we see higher highs and higher lows. Short-term support is at 1.2650 while resistance is at 1.28.
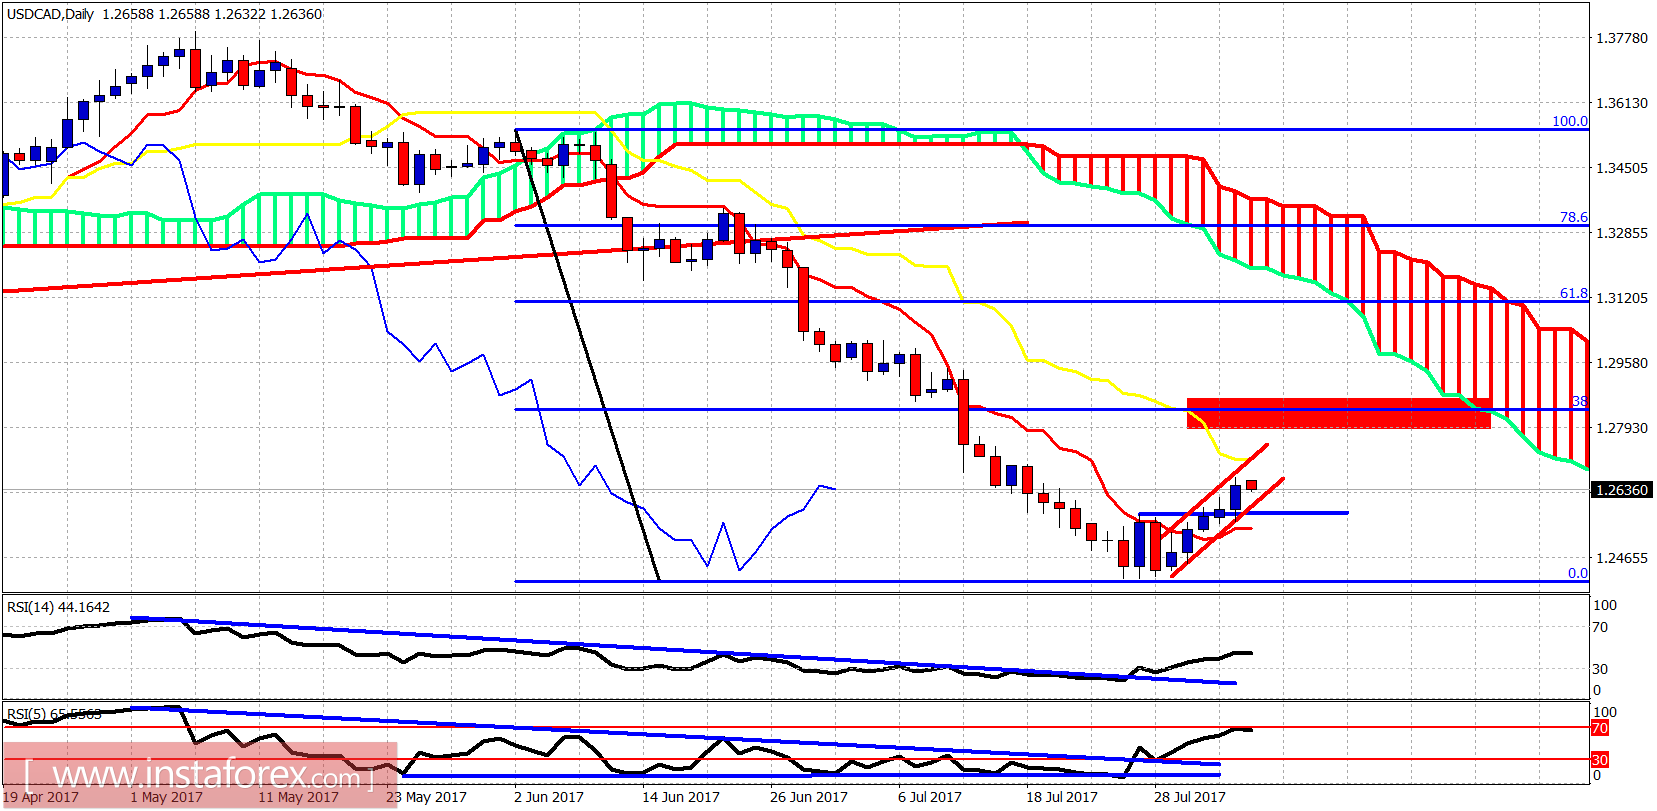
In a bigger time frame, the USD/CAD is making a counter trend bounce. Since 1.24-1.25 I have been calling for a bounce towards 1.28 where we find the 38% Fibonacci retracement. Price could even bounce higher towards 1.30 but for now, our goal is 1.28. There is no bearish divergence on the daily chart so we assume that after a stop at 1.28 we could expect a pull back.