 English
  Русский
 Bahasa Indonesia
 Bahasa Malay
 ไทย
ไทย Español
 Deutsch
 Български
 Français
 Tiếng Việt
 中文
中文 বাংলা
বাংলা हिन्दी
 Čeština
 Українська
 Română

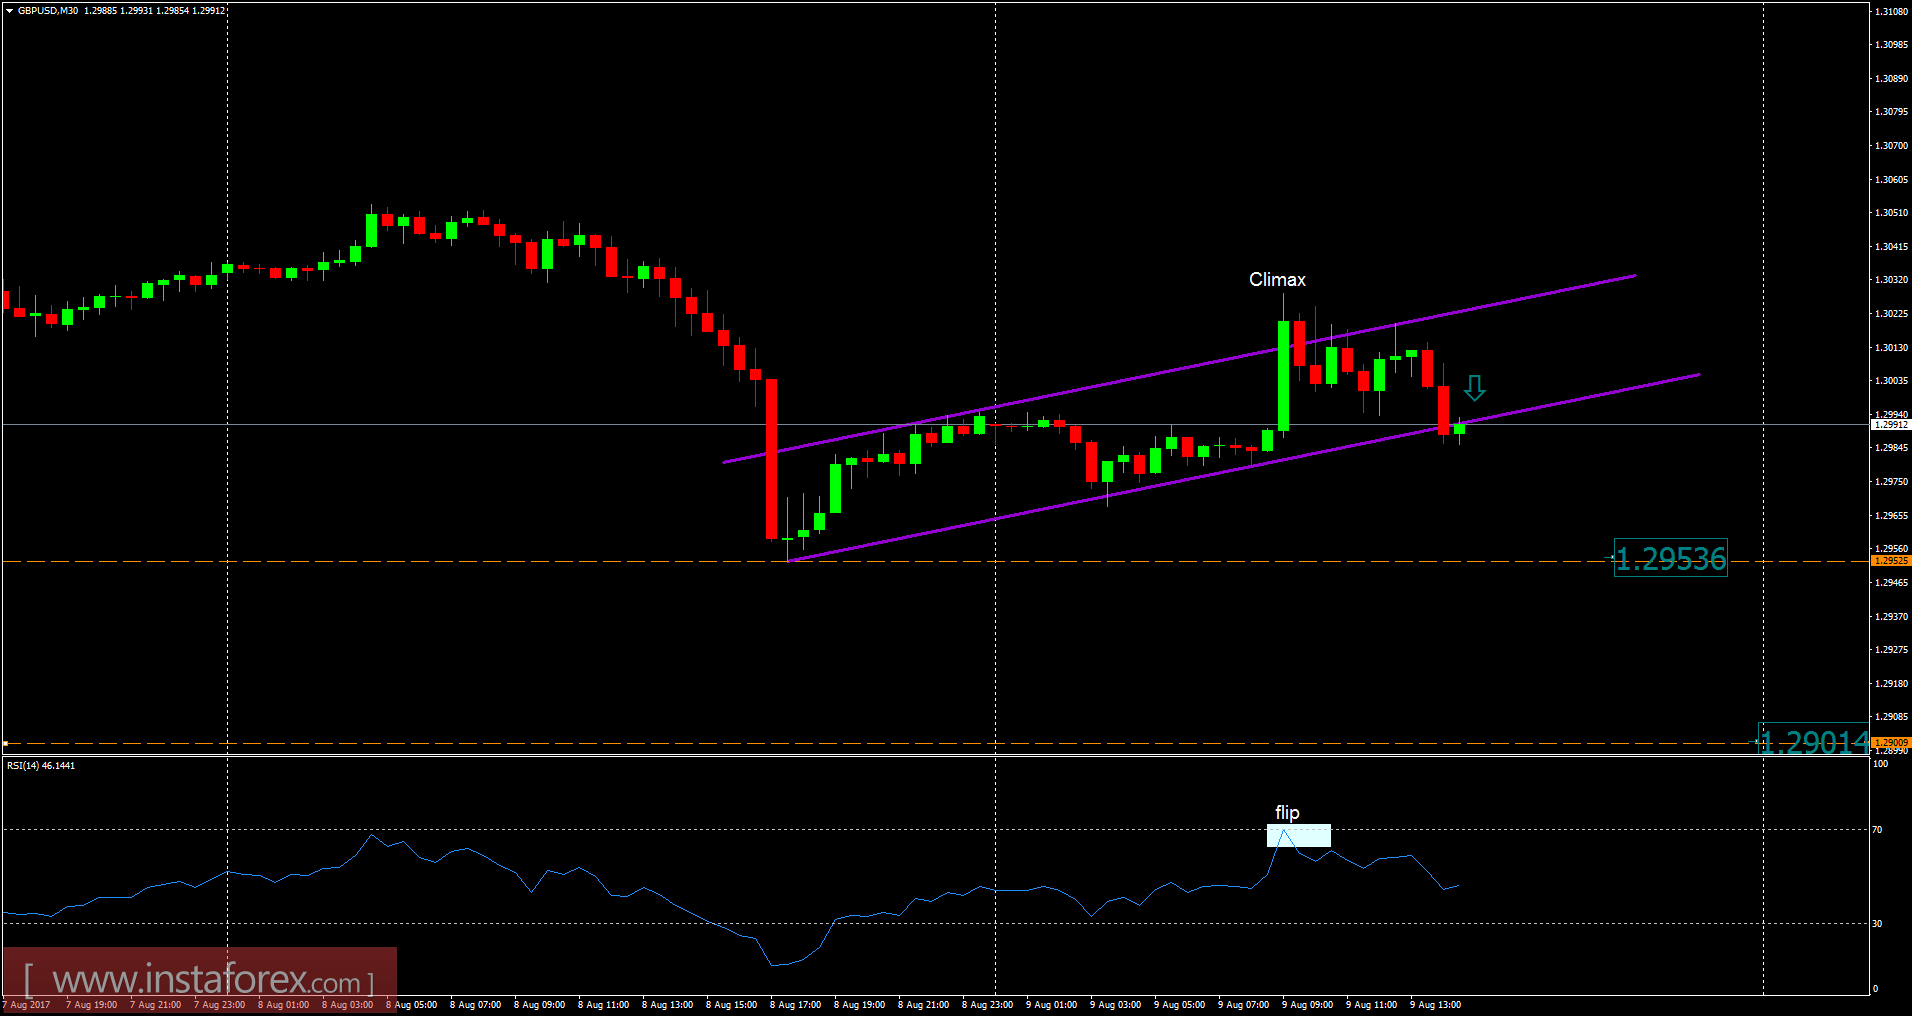
Recently, the GBP/USD pair has been trading upwards. The price tested the level of 1.3028. According to the 30M time frame, I found a broken bearish flag in the background, which is a sign that buying looks risky. I also found a flip from bullish to bearish on the RSI oscilator, which is another sign of weakness. My advice is to watch for potential selling opportunities. The downward targets are set at the price of 1.2950 and 1.2900.
Resistance levels:
R1: 1.3050
R2: 1.3100
R3: 1.3150
Support levels:
S1: 1.2950
S2: 1.2900
S3: 1.2840
Trading recommendations for today: watch for potential selling opportunities.