 English
  Русский
 Bahasa Indonesia
 Bahasa Malay
 ไทย
ไทย Español
 Deutsch
 Български
 Français
 Tiếng Việt
 中文
中文 বাংলা
বাংলা हिन्दी
 Čeština
 Українська
 Română

USDX is consolidated above the 200 SMA at H1 chart and looks forward to the resistance level of 94.00, which is a key psychological zone. If a breakout happens over there, then we might expect further advances in the index towards the 94.47 level. If a pullback happens at the current stage, one could expect a dynamic support in the 200 SMA.
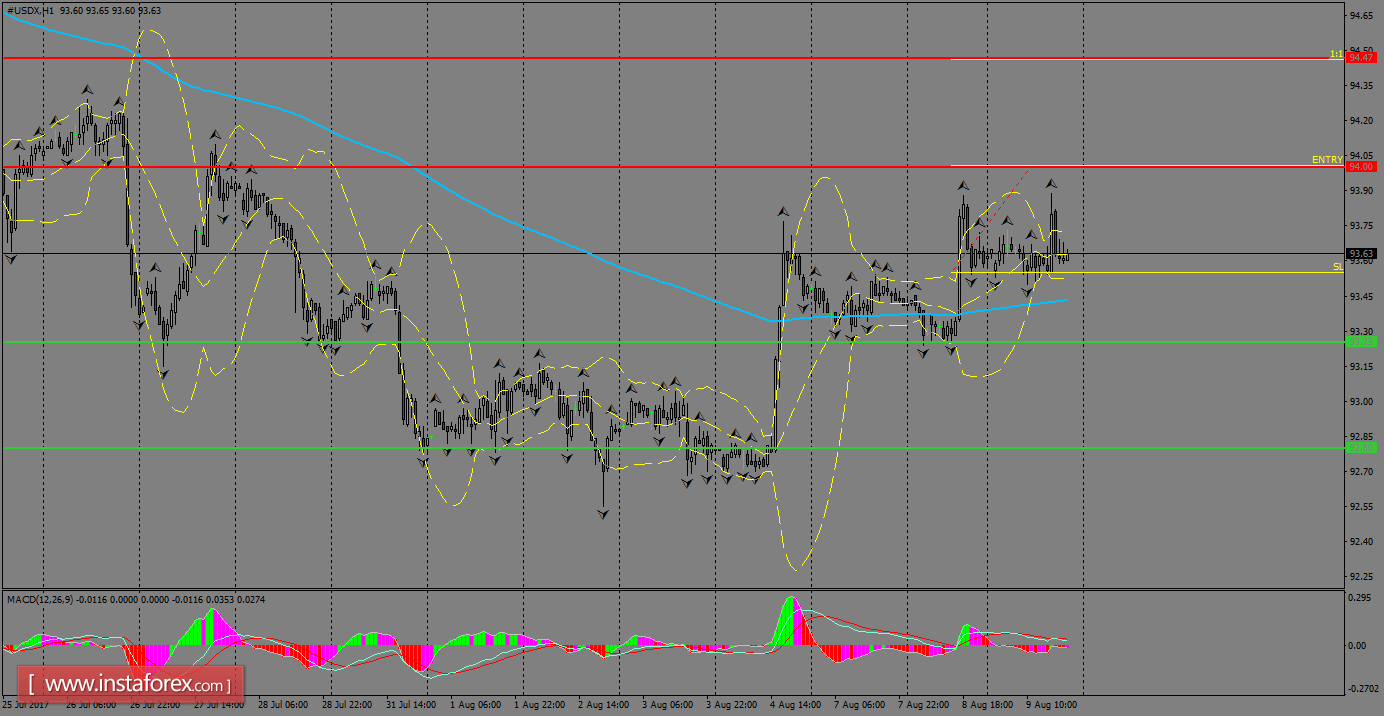
H1 chart's resistance levels: 94.00 / 94.47
H1 chart's support levels: 93.25 / 92.80
Trading recommendations for today: Based on the H1 chart, place buy (long) orders only if the USD Index breaks with a bullish candlestick; the resistance level is at 94.00, take profit is at 94.47 and stop loss is at 93.55.