 English
  Русский
 Bahasa Indonesia
 Bahasa Malay
 ไทย
ไทย Español
 Deutsch
 Български
 Français
 Tiếng Việt
 中文
中文 বাংলা
বাংলা हिन्दी
 Čeština
 Українська
 Română

The pair is ending the week with a sideways tone favored by the bears and with a support found at the 1.2955 level. If that zone gives up, bears could strengthen and could target the next support area of 1.2897. The 200 SMA still is setting the tone and one could expect further declines below 1.2900 anytime. MACD indicator is entering the negative territory, favoring the bearish idea.
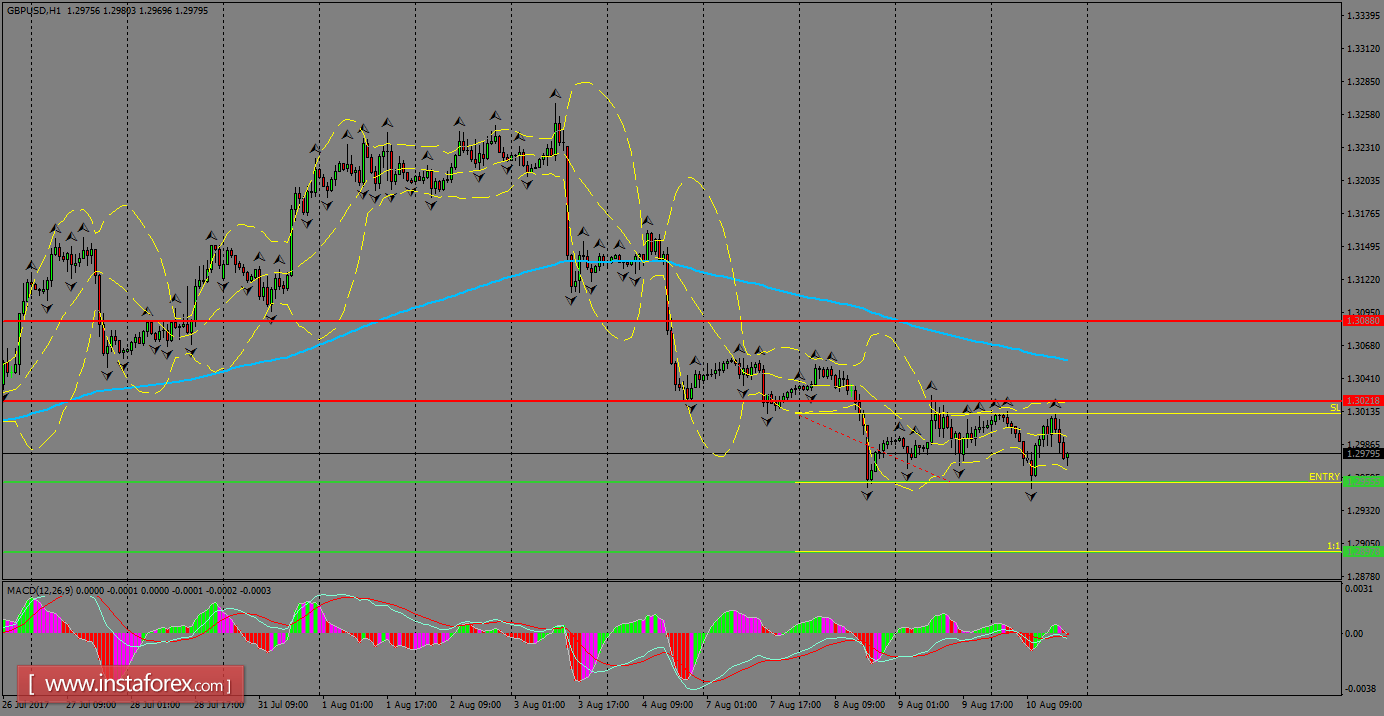
H1 chart's resistance levels: 1.3021 / 1.3080
H1 chart's support levels: 1.2955 / 1.2897
Trading recommendations for today: Based on the H1 chart, sell (short) orders only if the GBP/USD pair breaks a bearish candlestick; the support level is at 1.2955, take profit is at 1.2867 and stop loss is at 1.3011.