The Dollar index has not made any upside progress so far this week but remains in a short-term bullish mode and can give higher price levels next week.
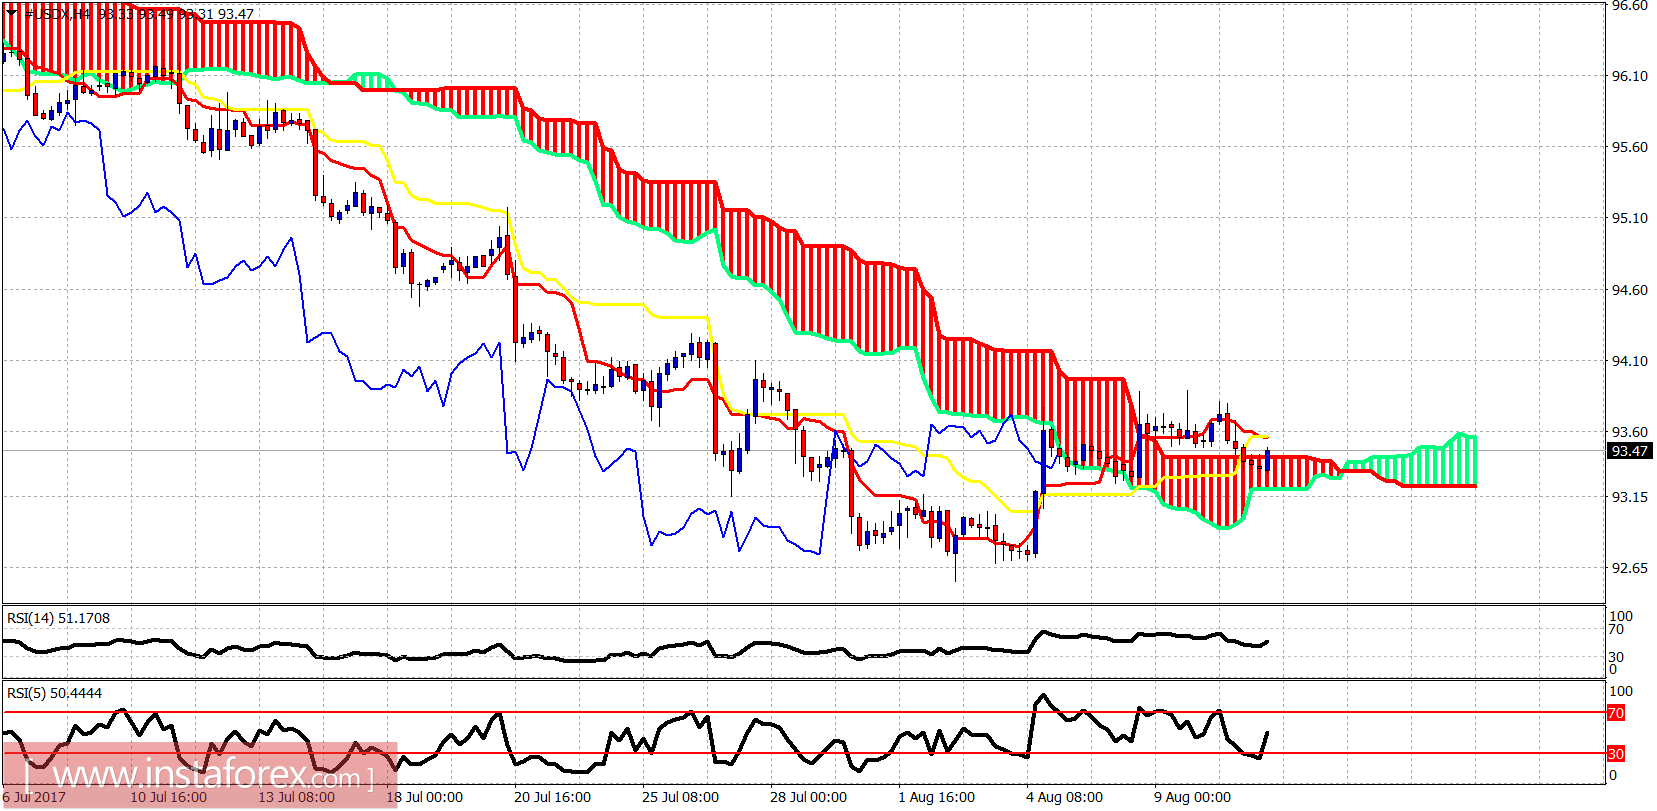
The price is mainly moving sideways this week. Price remains above the 4hour cloud helping bulls being optimistic for a move higher. Resistance is at 93.80-94. Support is at 93.20.
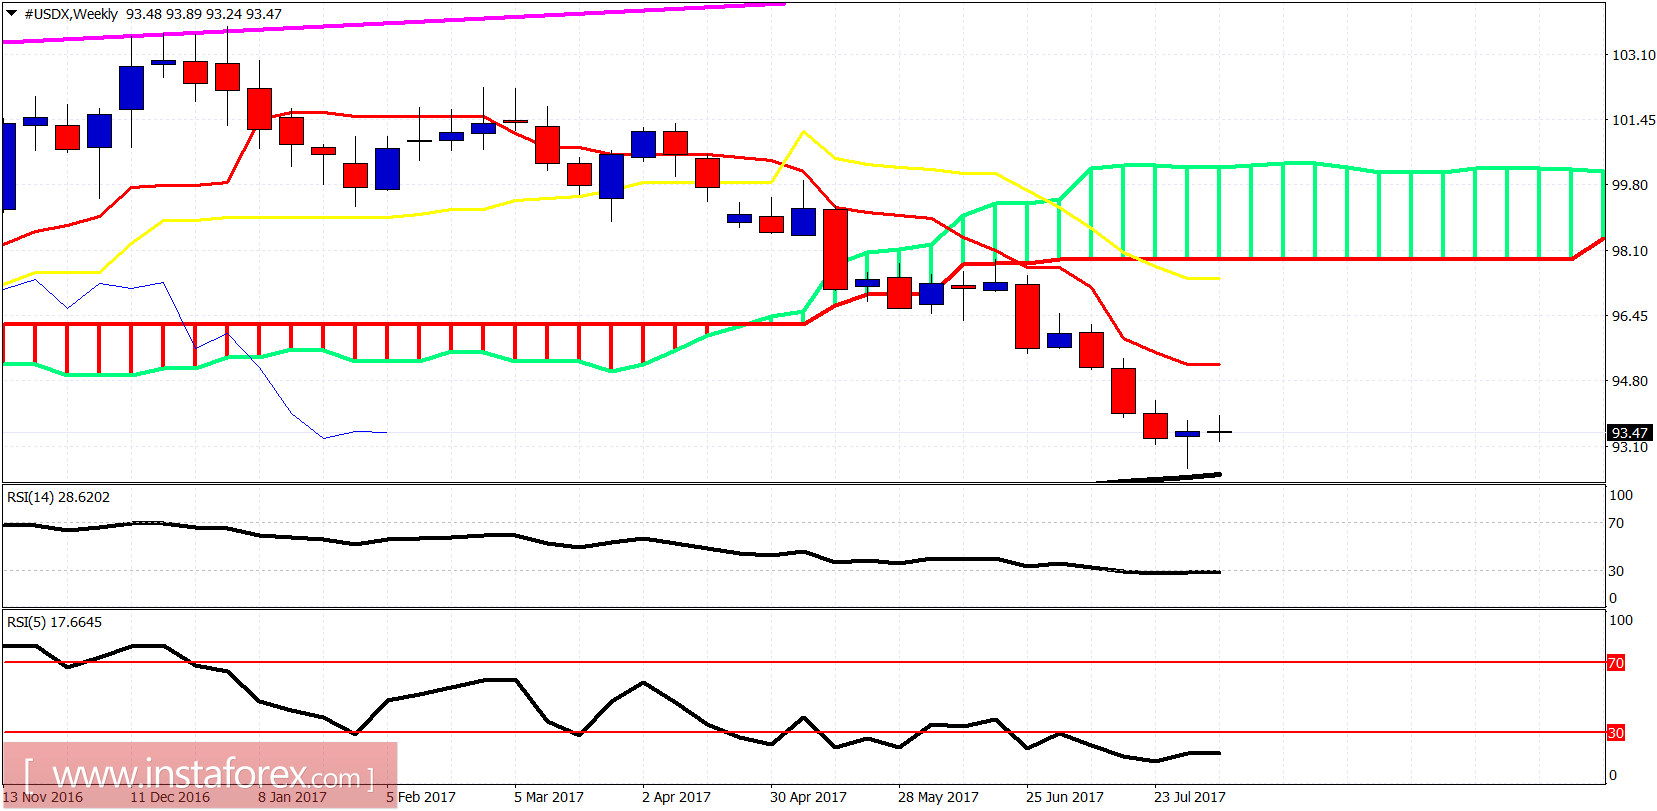
On a weekly basis, the price is below both the tenkan- and kijun-sen. The trend is bearish. A bounce has started and is expected to push price towards at least the 95-96 level where we find the tenkan-sen (Red line indicator). The weekly close of this week is important regarding the validity of the bullish reversal hammer candle pattern we saw last week.
*The market analysis posted here is meant to increase your awareness, but not to give instructions to make a trade
 English
  Русский
 Bahasa Indonesia
 Bahasa Malay
 ไทย
ไทย Español
 Deutsch
 Български
 Français
 Tiếng Việt
 中文
中文 বাংলা
বাংলা हिन्दी
 Čeština
 Українська
 Română
 Long-term review