 English
  Русский
 Bahasa Indonesia
 Bahasa Malay
 ไทย
ไทย Español
 Deutsch
 Български
 Français
 Tiếng Việt
 中文
中文 বাংলা
বাংলা हिन्दी
 Čeština
 Українська
 Română

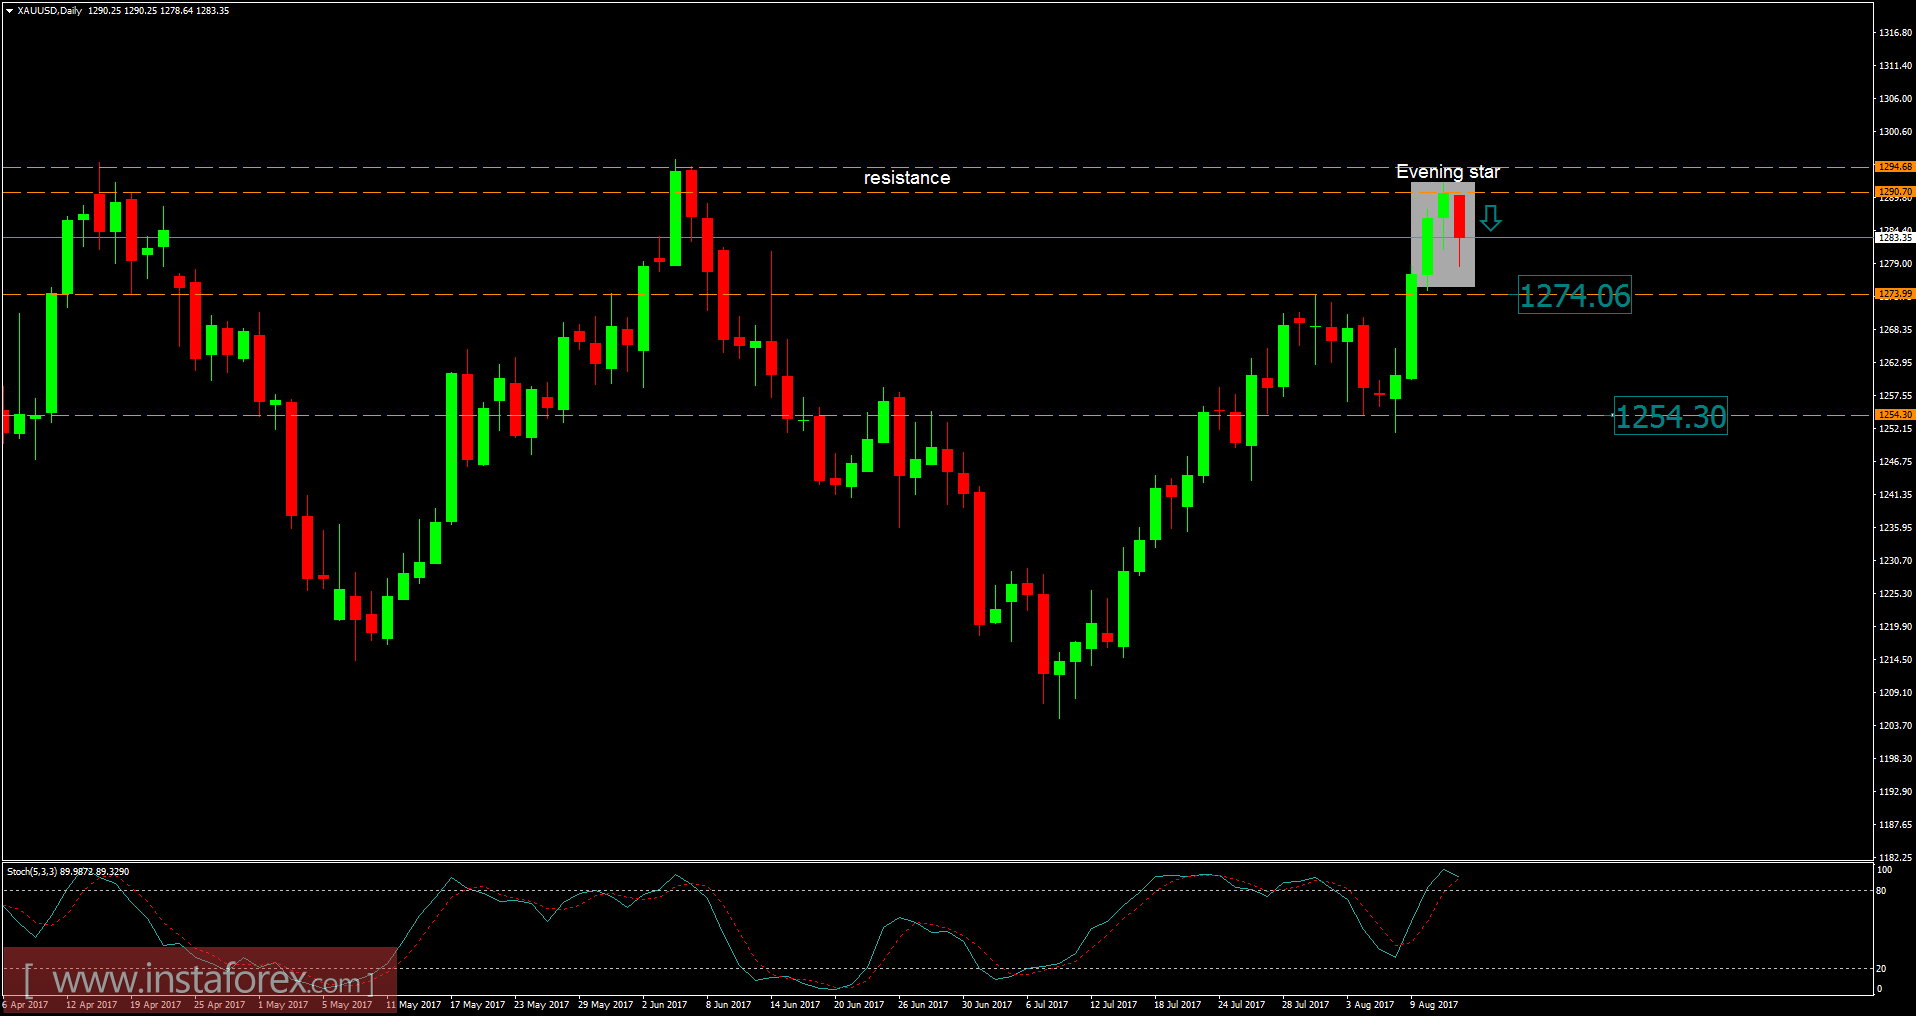
Recently, gold has been trading sideways at the price of $1,283.00. According to the daily time frame, I found a rejection from the strong resistance at the price of $1,290.00, which is a sign that buying looks risky. There is also an evening star formation (bearish formation), which is another sign of weakness. I added Stochastic oscilator and got overbought conditions. My advice is to watch for potential selling opportunities. The downward targets are set at the price of $1,274.00 and $1,254.00.
Resistance levels:
R1: $1,295.75
R2: $1,296.75
R3: $1,298.00
Support levels:
S1: $1,293.52
S2: $1,295.35
S3: $1,291.15
Trading recommendations for today: watch for potential selling opportunities.