 English
  Русский
 Bahasa Indonesia
 Bahasa Malay
 ไทย
ไทย Español
 Deutsch
 Български
 Français
 Tiếng Việt
 中文
中文 বাংলা
বাংলা हिन्दी
 Čeština
 Українська
 Română

GBP/USD still holds the support level of 1.2850 and one could expect a recovery to re-test the 200 SMA at H1 chart. Nothing has changed since our latest report about the pair, but the risk is still targeting to the downside and if it breaks below 1.2850, further declines are expected to take place towards 1.2761.
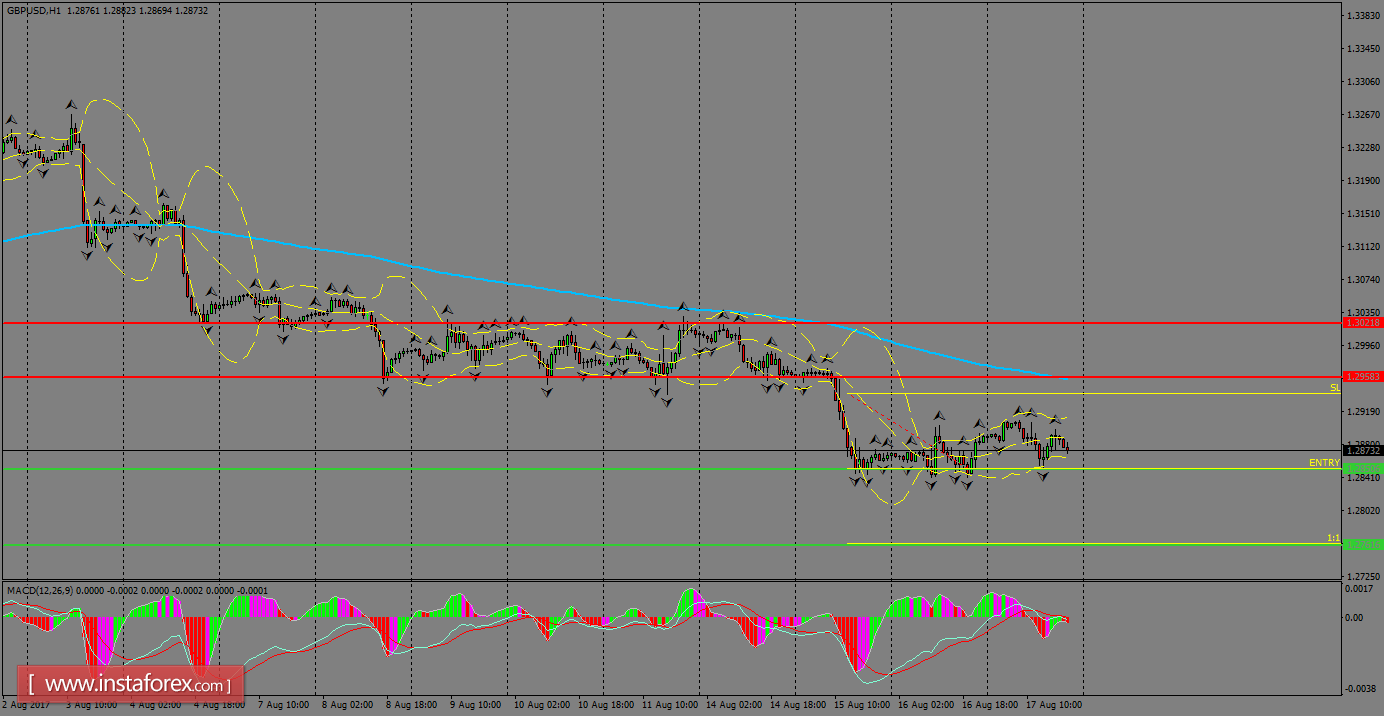
H1 chart's resistance levels: 1.2958 / 1.3021
H1 chart's support levels: 1.2850 / 1.2761
Trading recommendations for today: Based on the H1 chart, sell (short) orders only if the GBP/USD pair breaks a bearish candlestick; the support level is at 1.2850, take profit is at 1.2761 and stop loss is at 1.2938.