English
  Русский
 Bahasa Indonesia
 Bahasa Malay
 ไทย
ไทย Español
 Deutsch
 Български
 Français
 Tiếng Việt
 中文
中文 বাংলা
বাংলা हिन्दी
 Čeština
 Українська
 Română

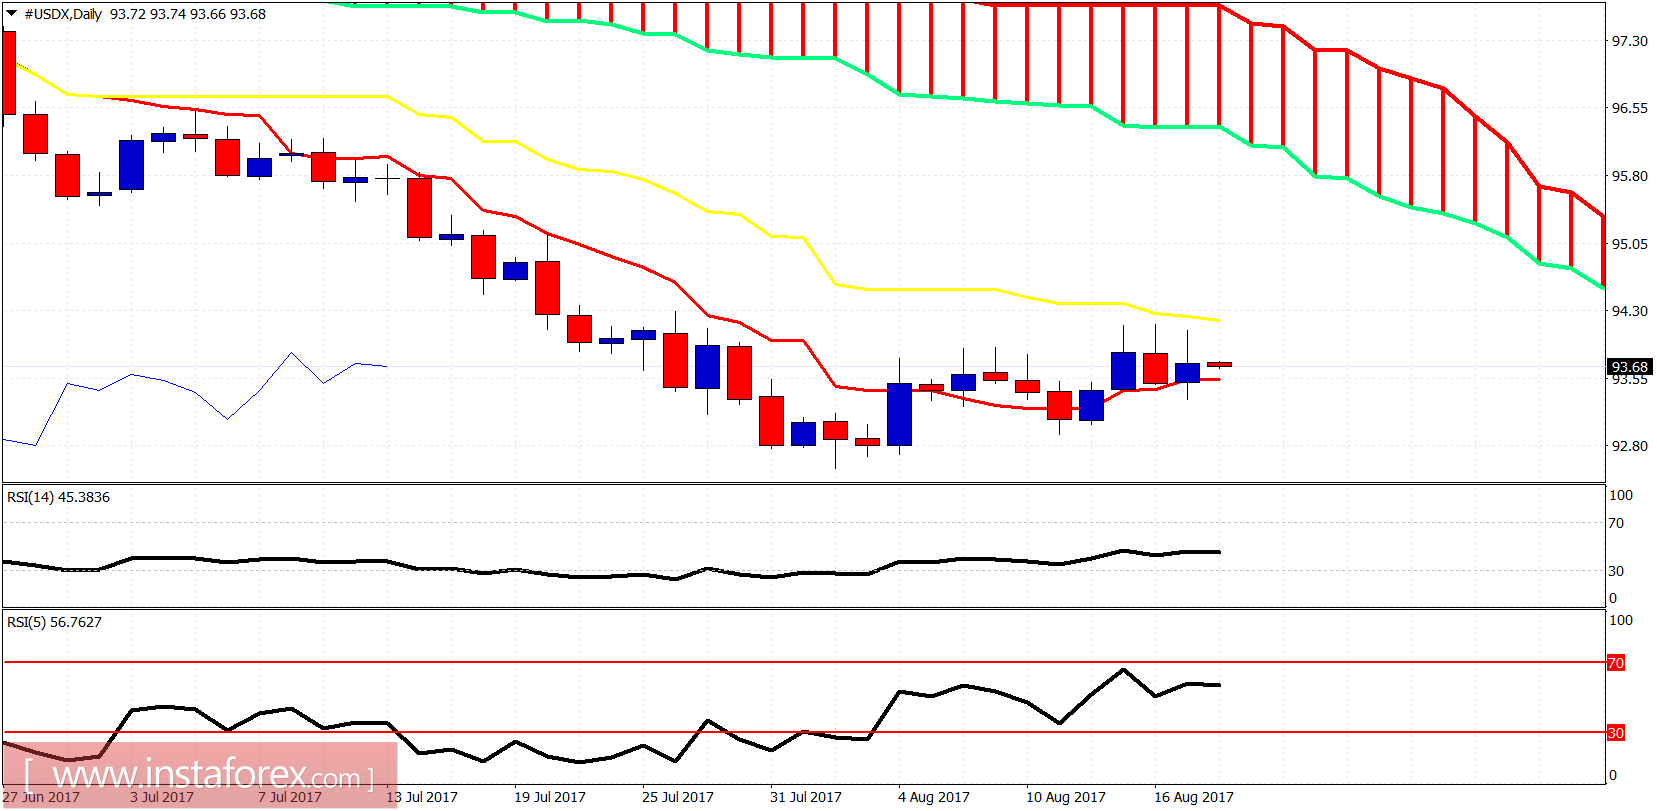
The Dollar index remains in a bullish short-term trend. Price is making higher highs and higher lows. However, the momentum is not as strong as we expected and this could imply that another strong downward move towards 91 could come soon.
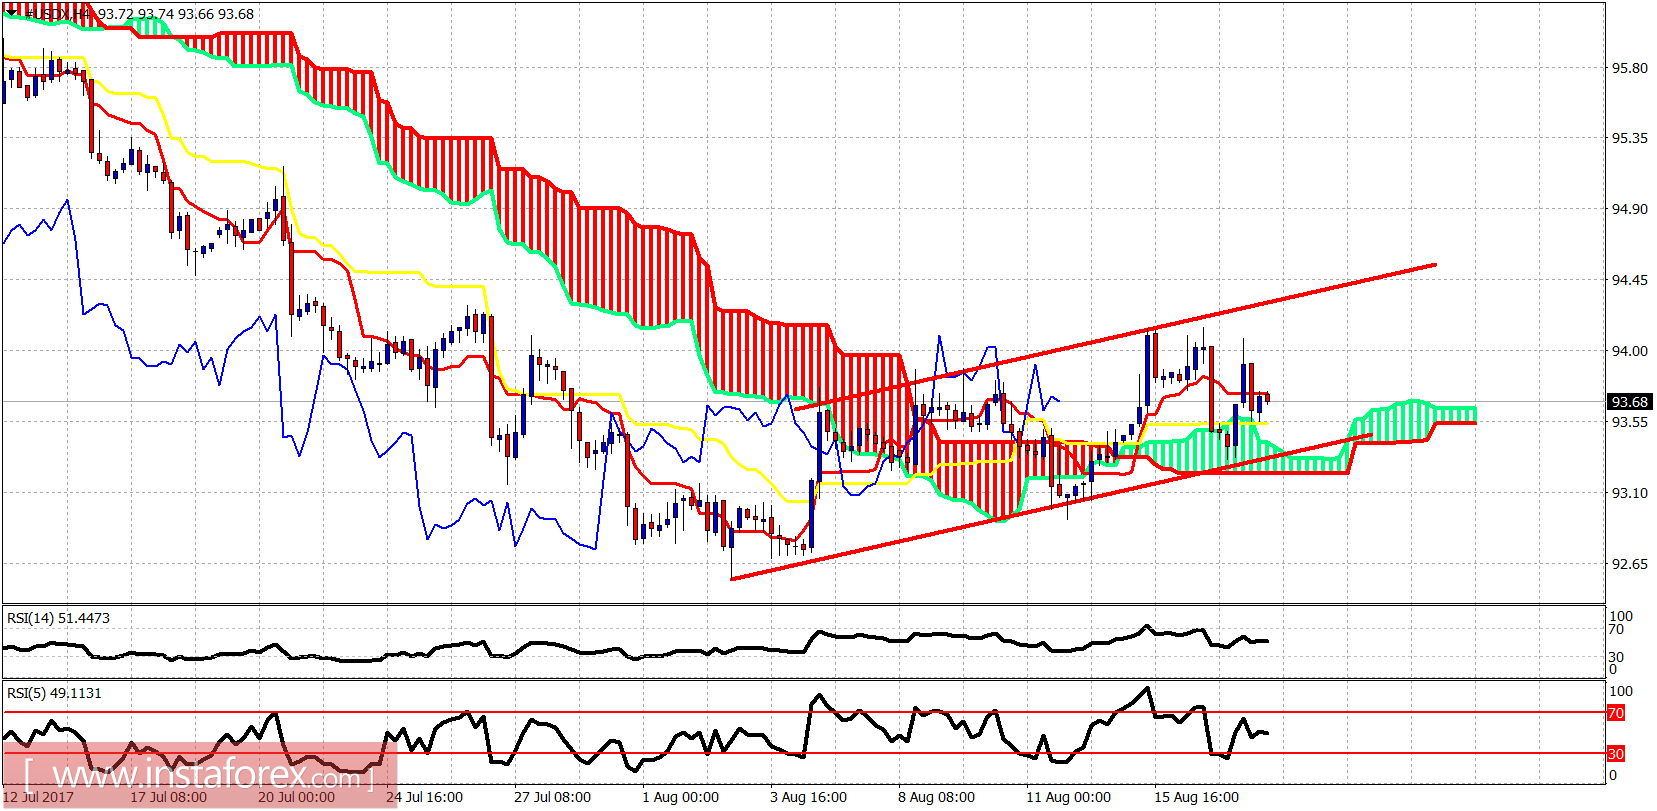
Red lines - bullish channel
The price is trading above the 4 hour Kumo (cloud). Price is also inside the bullish red channel. Support is at 93.30 while resistance is at 94.30. The form of the rise is corrective in nature. Once support fails to hold on the 4-hour chart, we should expect heavy selling to push the index to new monthly lows.