 English
  Русский
 Bahasa Indonesia
 Bahasa Malay
 ไทย
ไทย Español
 Deutsch
 Български
 Français
 Tiếng Việt
 中文
中文 বাংলা
বাংলা हिन्दी
 Čeština
 Українська
 Română

The pair will have an interesting week given that the sideways range remains intact and one could expect a break of this area soon. If GBP/USD manages to break below 1.2850, it can open the doors to test the 1.2761 level, which is our preferred scenario as the 200 SMA at H1 chart continues to stay above the current price.
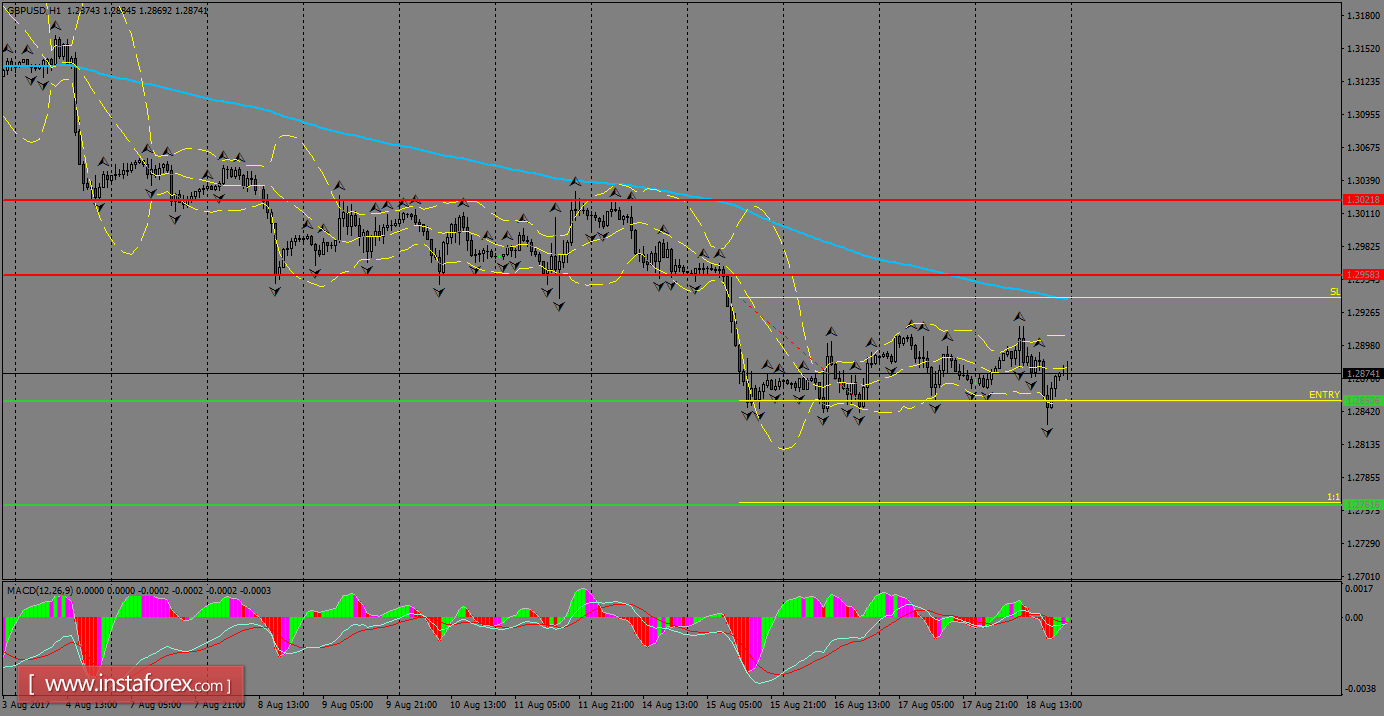
H1 chart's resistance levels: 1.2958 / 1.3021
H1 chart's support levels: 1.2850 / 1.2761
Trading recommendations for today: Based on the H1 chart, place sell (short) orders only if the GBP/USD pair breaks a bearish candlestick; the support level is at 1.2850, take profit lies at 1.2761 and stop loss is found at 1.2938.