 English
  Русский
 Bahasa Indonesia
 Bahasa Malay
 ไทย
ไทย Español
 Deutsch
 Български
 Français
 Tiếng Việt
 中文
中文 বাংলা
বাংলা हिन्दी
 Čeština
 Українська
 Română

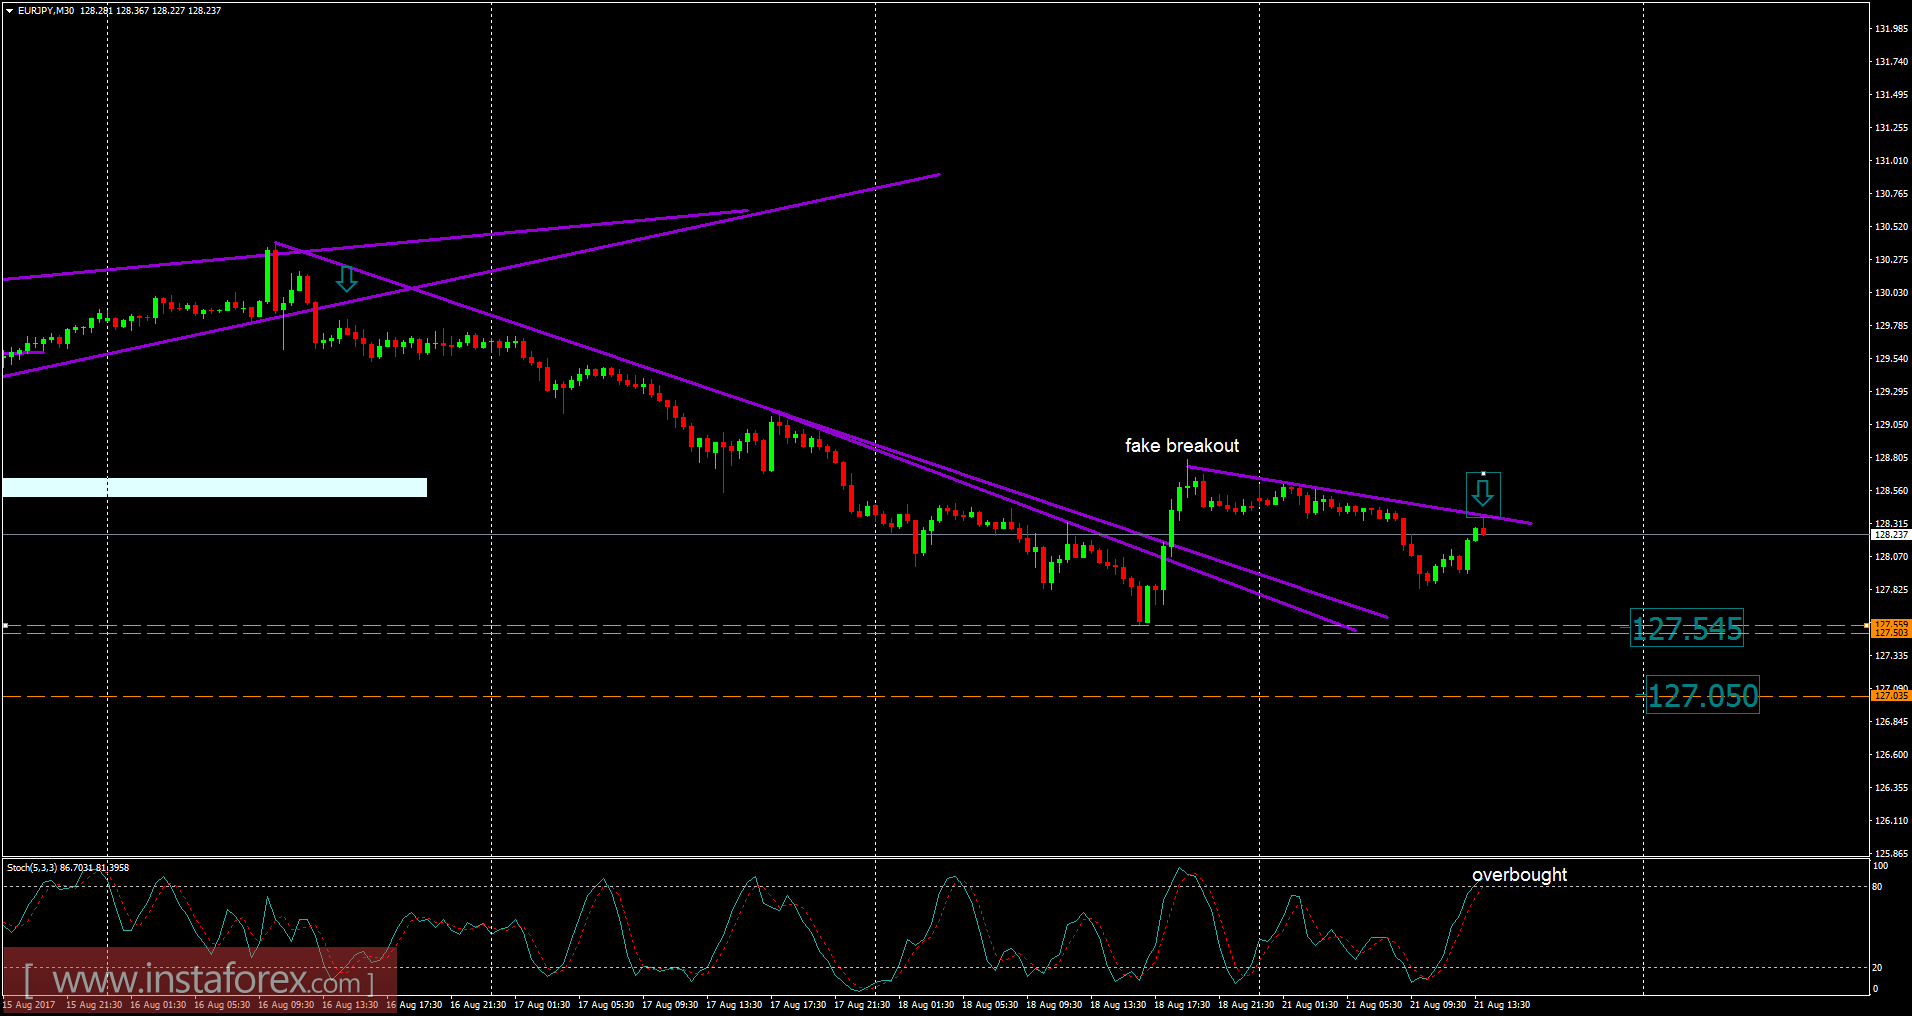
Recently, the EUR/JPY pair has been trading sideways at the price of 128.20. According to the 30M time frame, I found a fake breakout of supply trendline in the background and successful testing of the intraday supply trendline, which is a sign that buying looks risky. The stochastic oscilator is showing an overbought condition, which is another sign of weakness. My advice is to watch for potential selling opportunities. The downward targets are set at the price of 127.55 and 127.00.
Resistance levels:
R1: 129.10
R2: 129.90
R3: 131.00
Support levels:
S1: 127.95
S2: 127.55
S3: 126.40
Trading recommendations for today: watch for potential selling opportunities.