 English
  Русский
 Bahasa Indonesia
 Bahasa Malay
 ไทย
ไทย Español
 Deutsch
 Български
 Français
 Tiếng Việt
 中文
中文 বাংলা
বাংলা हिन्दी
 Čeština
 Українська
 Română

The index recovered from Monday's low and it's challenging now the 200 SMA at H1 chart. The structure remains in sideways and there is no a clear path to follow in the short-term, other than a breakout of the range. If we witness a break above 93.72, further gains are expected to take place towards 94.11.
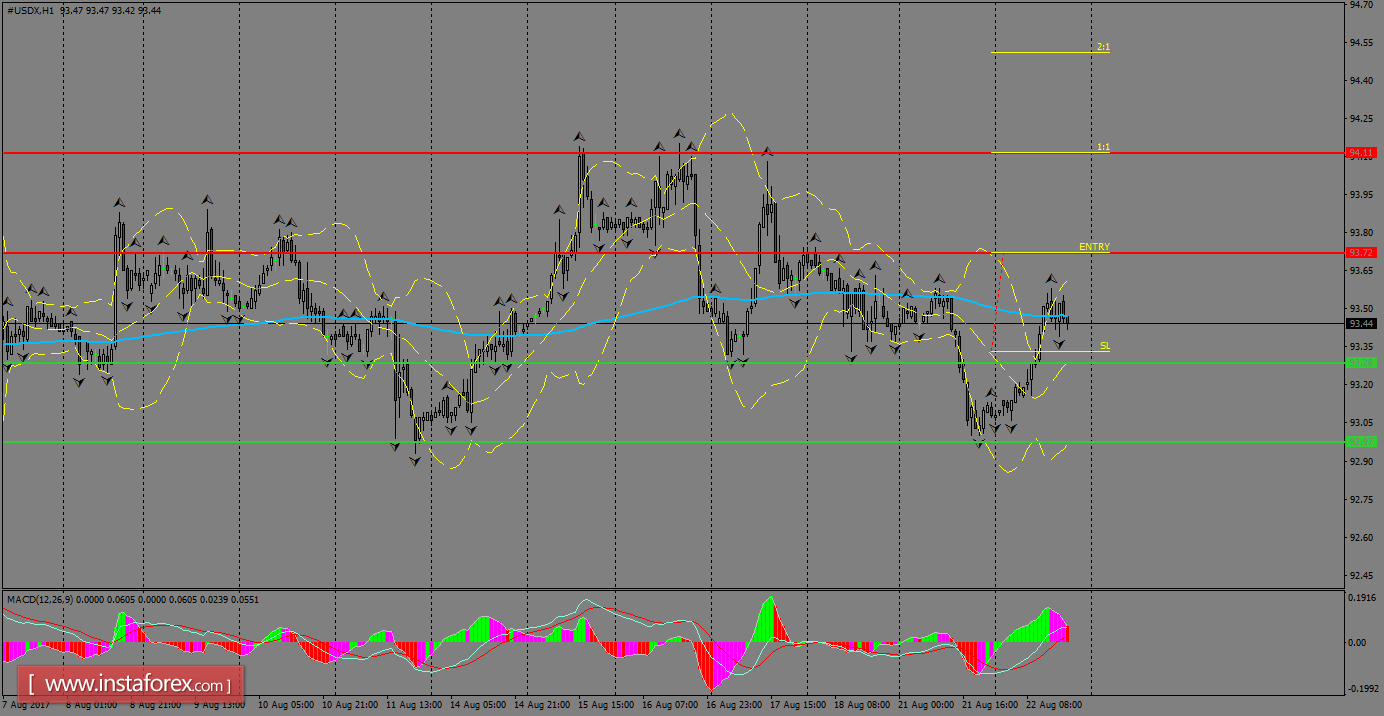
H1 chart's resistance levels: 93.72 / 94.11
H1 chart's support levels: 93.28 / 92.97
Trading recommendations for today: Based on the H1 chart, place buy (long) orders only if the USD Index breaks with a bullish candlestick; the resistance level is at 93.72, take profit is at 94.11 and stop loss is at 93.33.