 English
  Русский
 Bahasa Indonesia
 Bahasa Malay
 ไทย
ไทย Español
 Deutsch
 Български
 Français
 Tiếng Việt
 中文
中文 বাংলা
বাংলা हिन्दी
 Čeština
 Українська
 Română

Gold price has pulled back again towards $1,282 support yesterday but it did not break it. Price remains trapped inside a short-term trading range of $1,295-$1,282. We could push lower towards $1,275 but overall trend remains bullish and any pullback is seen as buying opportunity.
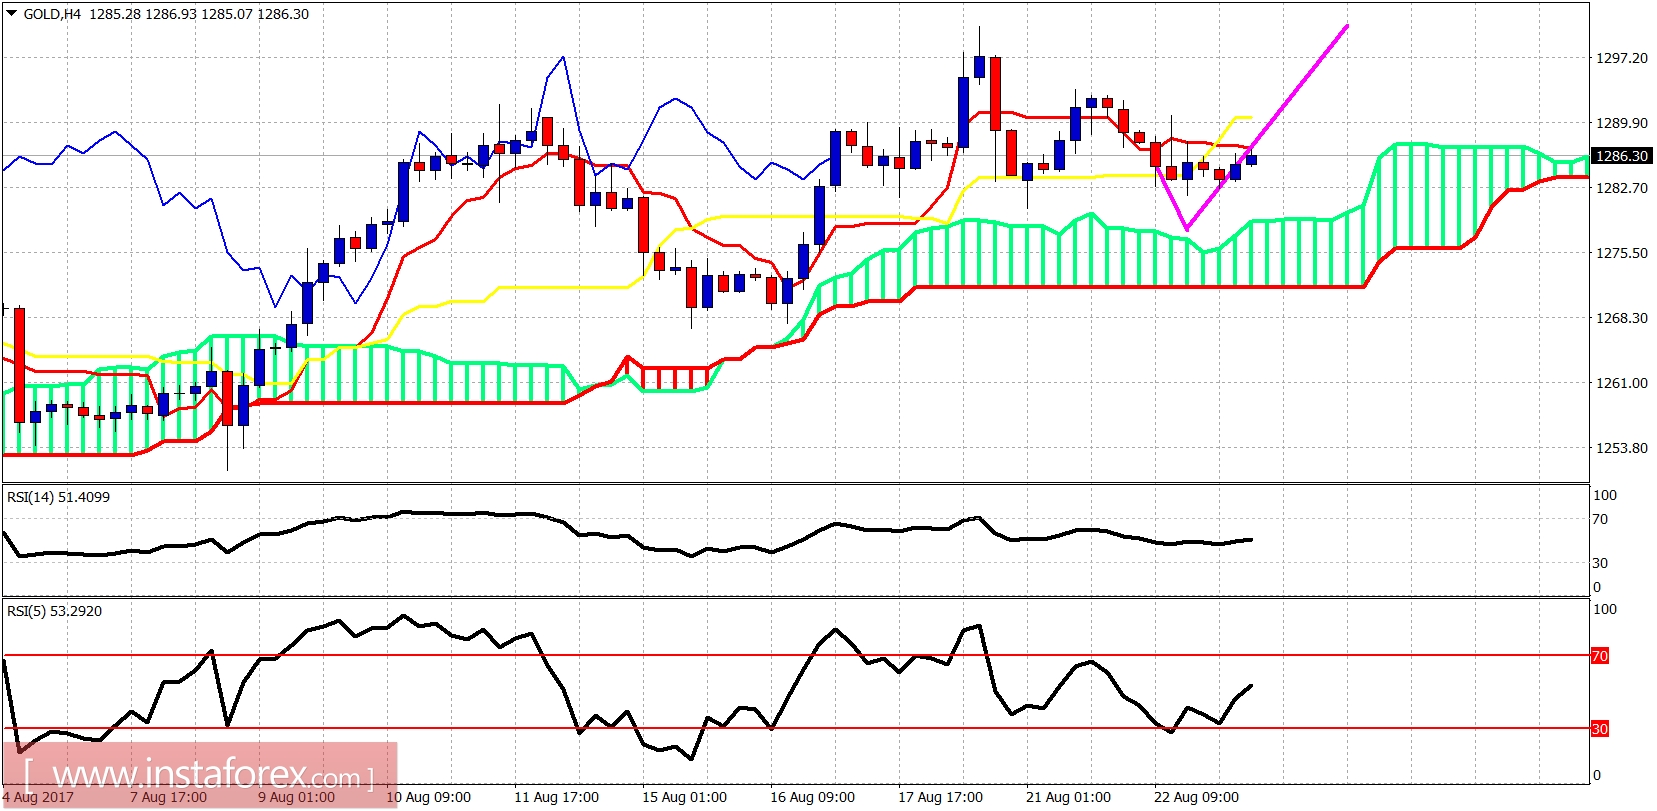
Blue line - long-term support
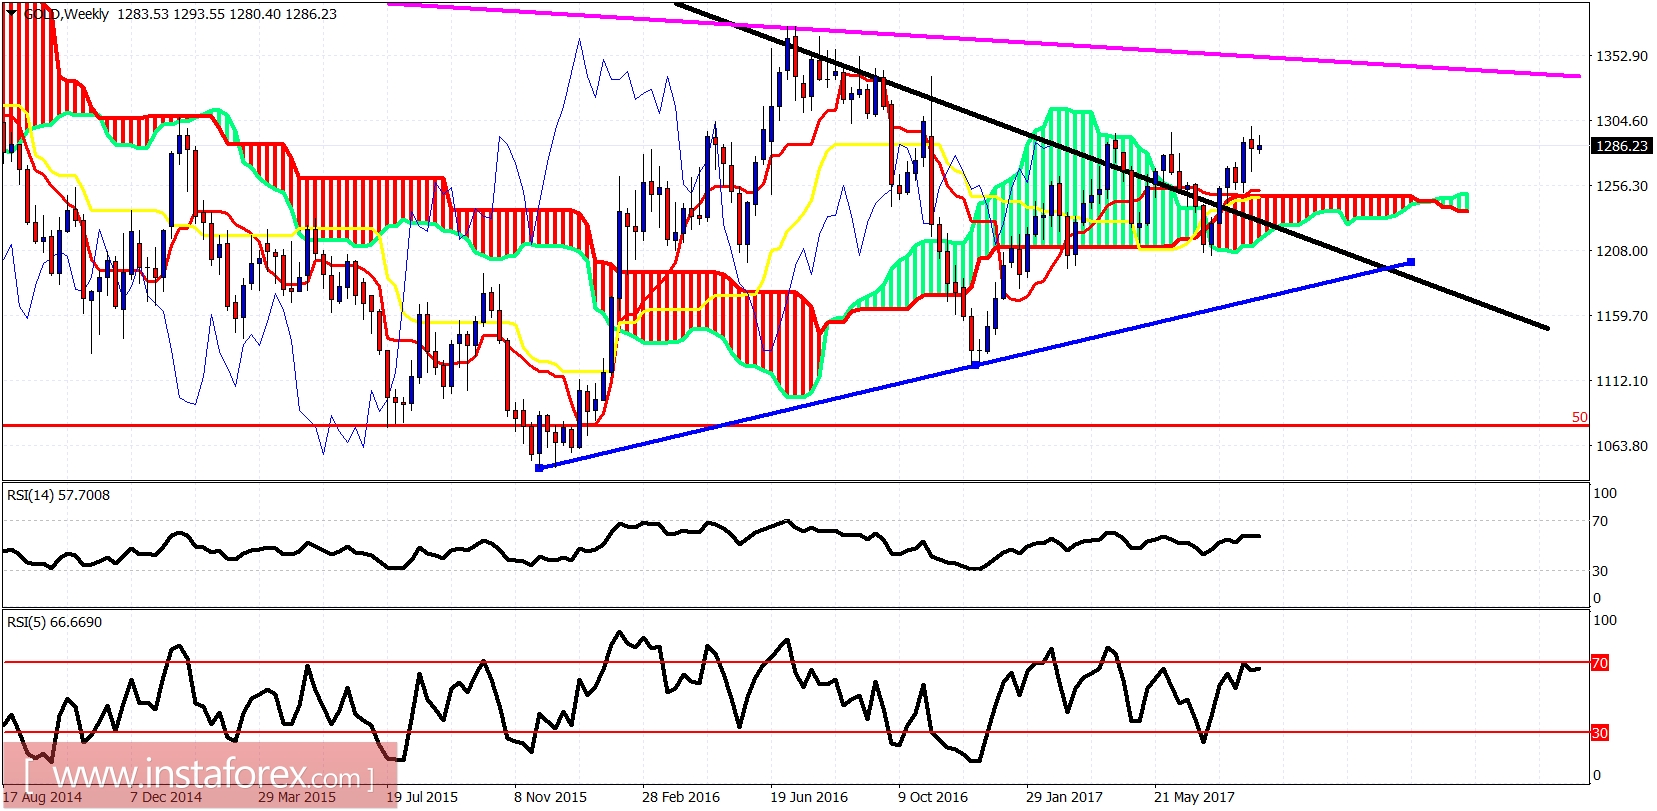
Nothing new on the weekly chart. We have a weekly breakout. The price back tested the cloud support and is making higher highs. The trend is bullish and I expect gold to move towards $1,320-$1,350 over the coming weeks.