English
  Русский
 Bahasa Indonesia
 Bahasa Malay
 ไทย
ไทย Español
 Deutsch
 Български
 Français
 Tiếng Việt
 中文
中文 বাংলা
বাংলা हिन्दी
 Čeština
 Українська
 Română

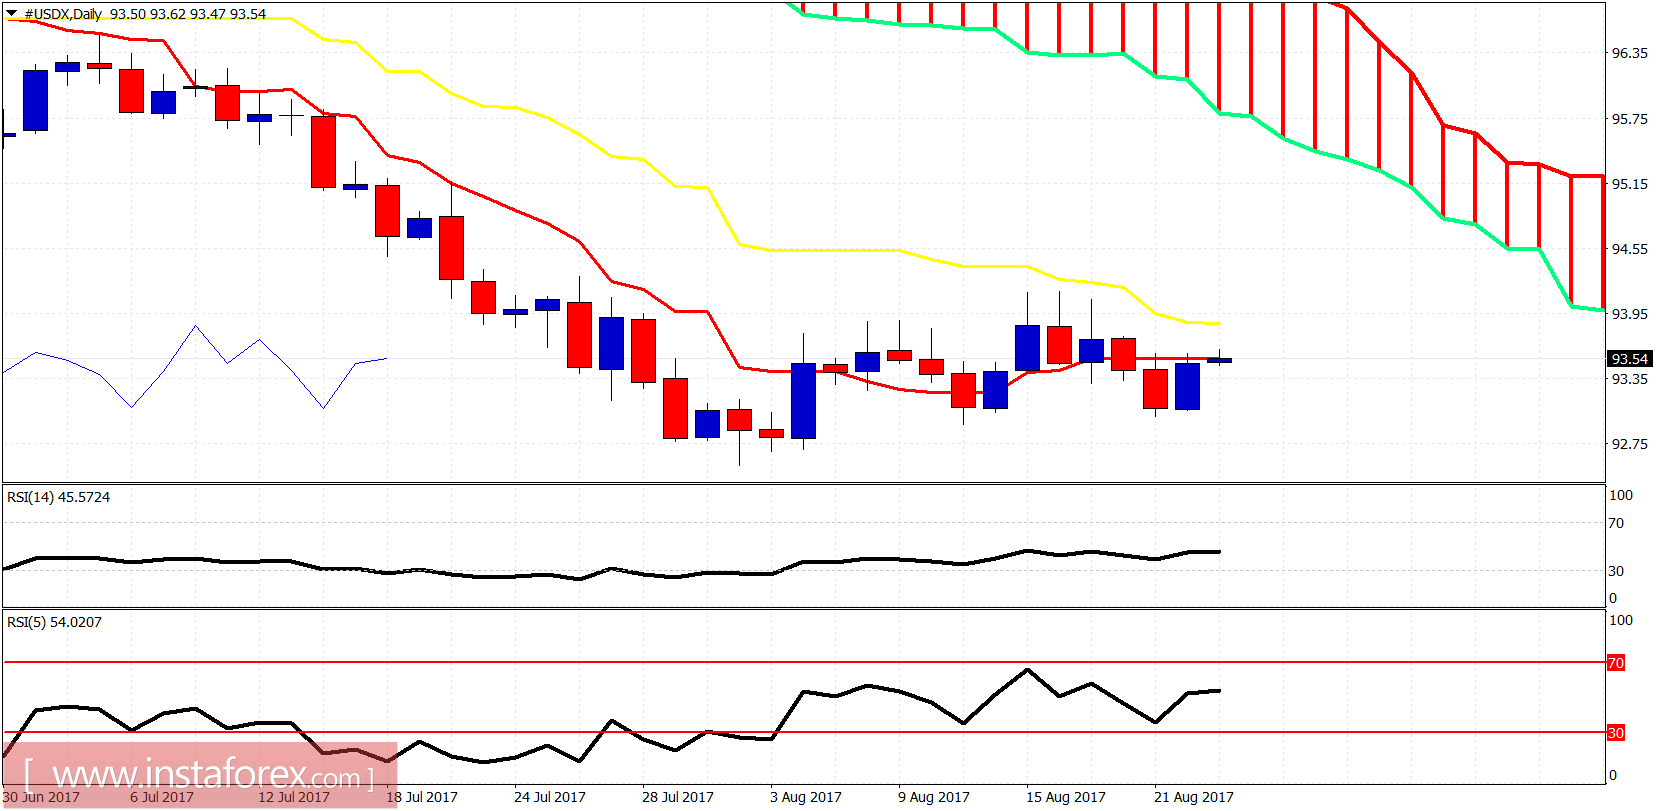
The US dollar index broke below the cloud and the channel yesterday but right away we saw a bounce that is back testing the broken support and is trying to mark the breakdown as a false one.
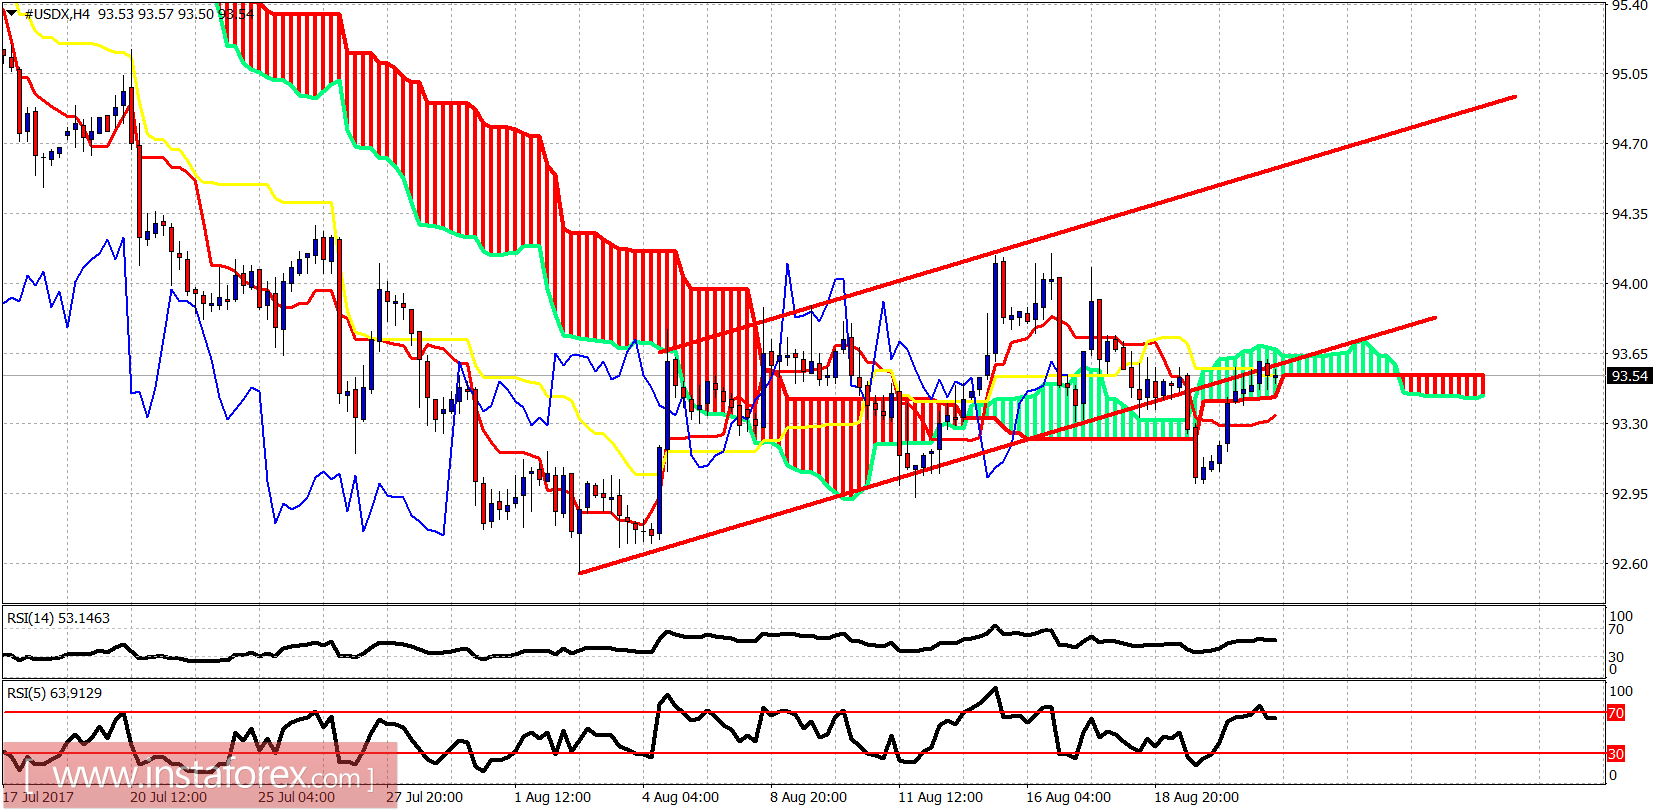
The dollar index is trying to move back above the 4 hour Kumo and inside the bullish channel. This bounce is corrective and we should expect a rejection soon to turn the price lower. The support is found at 93.30 and resistance lies at 93.70.