English
  Русский
 Bahasa Indonesia
 Bahasa Malay
 ไทย
ไทย Español
 Deutsch
 Български
 Français
 Tiếng Việt
 中文
中文 বাংলা
বাংলা हिन्दी
 Čeština
 Українська
 Română

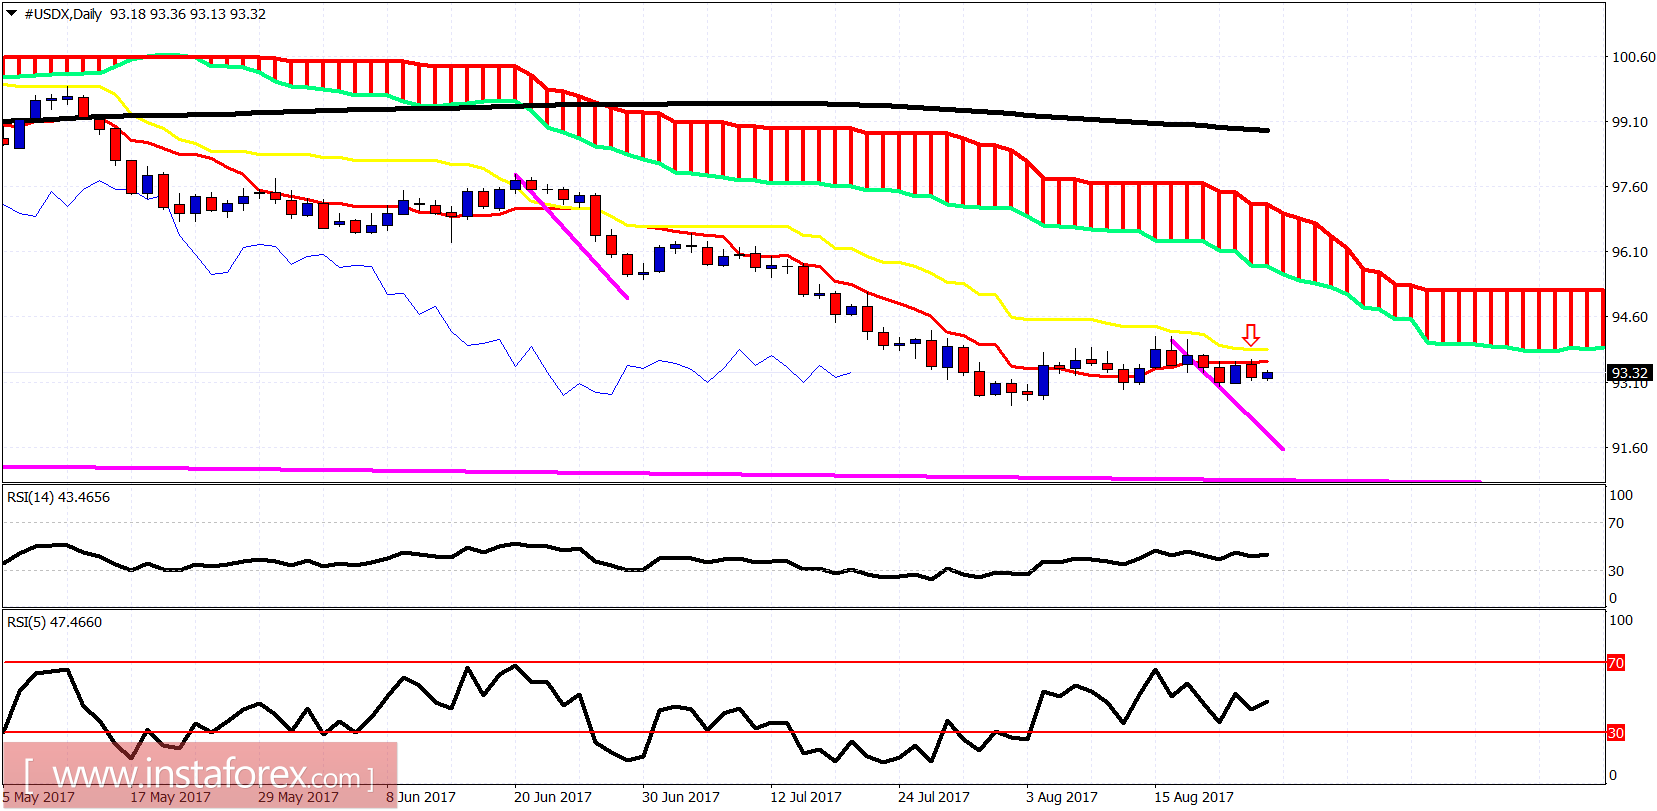
The US dollar index got rejected as expected after back testing the broken channel and cloud resistance. I expect the dollar index to push lower towards 91.60 over the coming weeks.
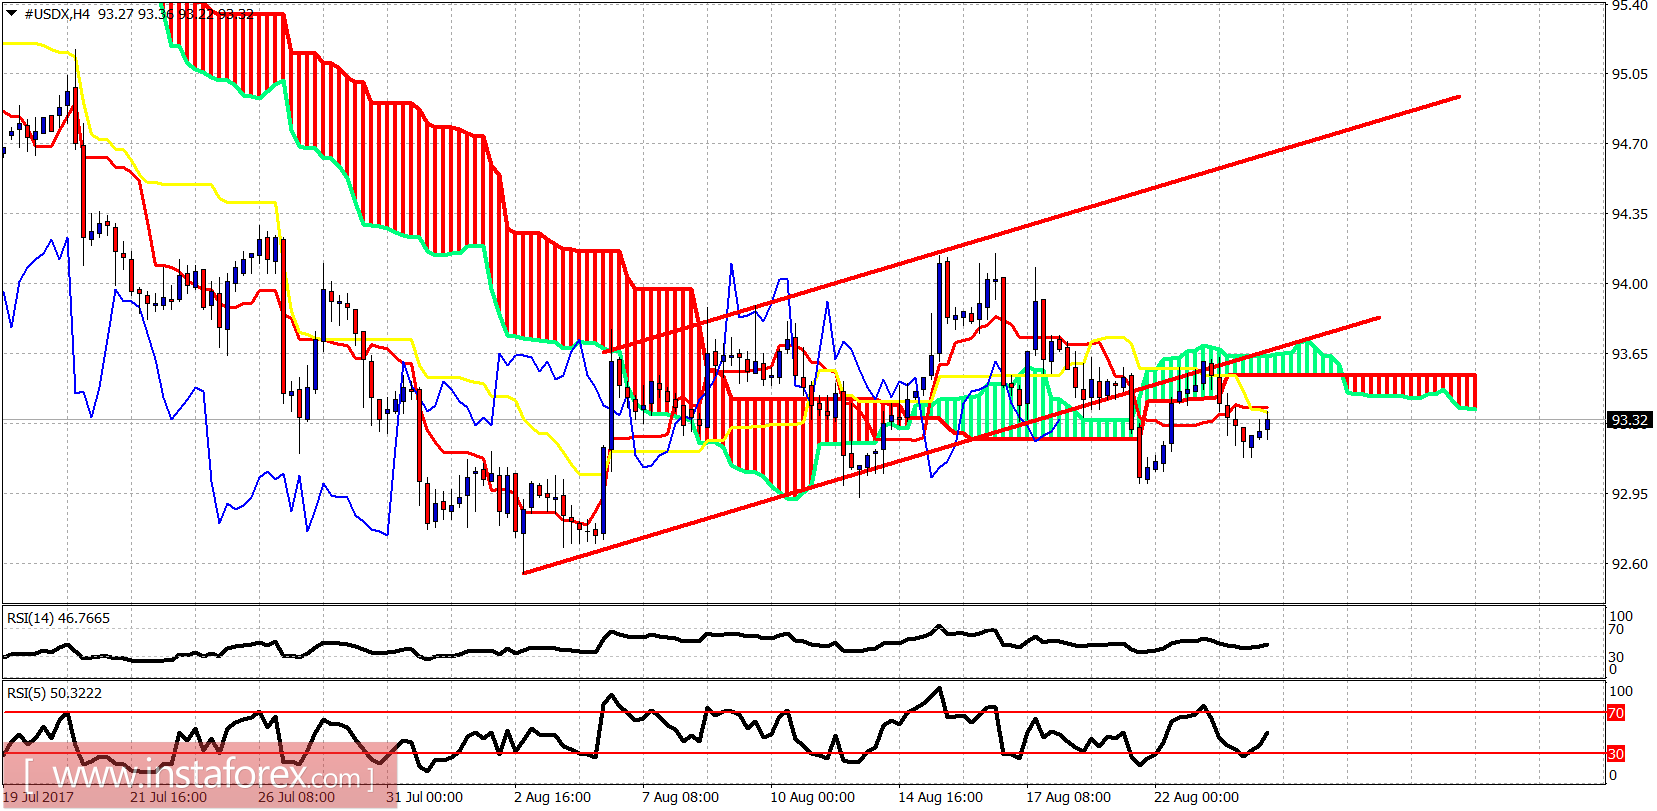
The dollar index is trading below the 4 hour Kumo. Yesterday we back tested the broken channel and the Kumo cloud. The rejection is a bearish sign. Support is at 93.10 and the next one at 92.90. Resistance is found at 93.40 and the next one at 93.55.