 English
  Русский
 Bahasa Indonesia
 Bahasa Malay
 ไทย
ไทย Español
 Deutsch
 Български
 Français
 Tiếng Việt
 中文
中文 বাংলা
বাংলা हिन्दी
 Čeština
 Українська
 Română

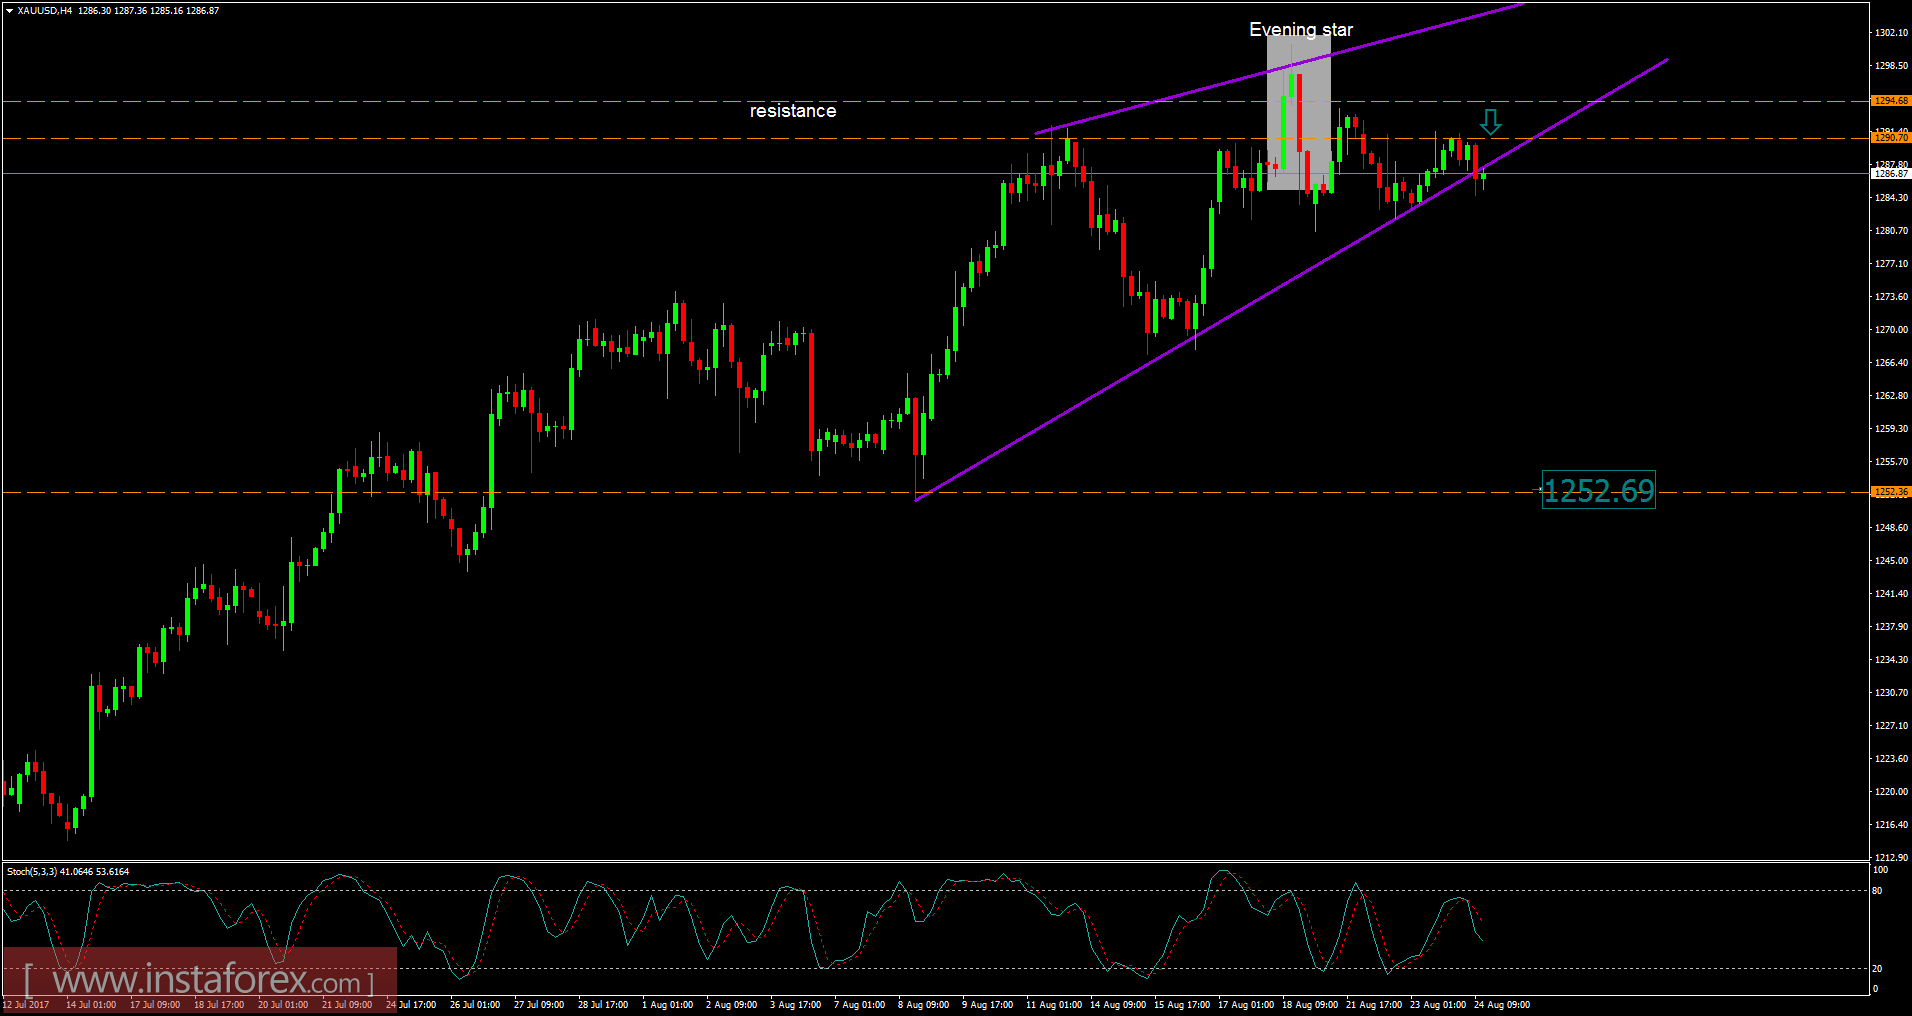
Recently, the Gold has been trading upwards. The price tested the level of $1.3000. Anyway, according to the 4H timeframe, I found a fake breakout of key resistance at the price of $1,291.00, which is a sign that buying looks risky. I found an evening start formation (bearish candle formation), which is another sign of weakness. Stochastic oscillator is showing an overbought condition, which represents a bullish extension. My advice is to watch for potential selling opportunities. The downward target is set at the price of $1,252.70.
Resistance levels:
R1: $1,298.00
R2: $1,302.00
R3: $1,307.50
Support levels:
S1: $1,289.00
S2: $1,284.00
S3: $1,280.00
Trading recommendations for today: watch for potential selling opportunities.