 English
  Русский
 Bahasa Indonesia
 Bahasa Malay
 ไทย
ไทย Español
 Deutsch
 Български
 Français
 Tiếng Việt
 中文
中文 বাংলা
বাংলা हिन्दी
 Čeština
 Українська
 Română

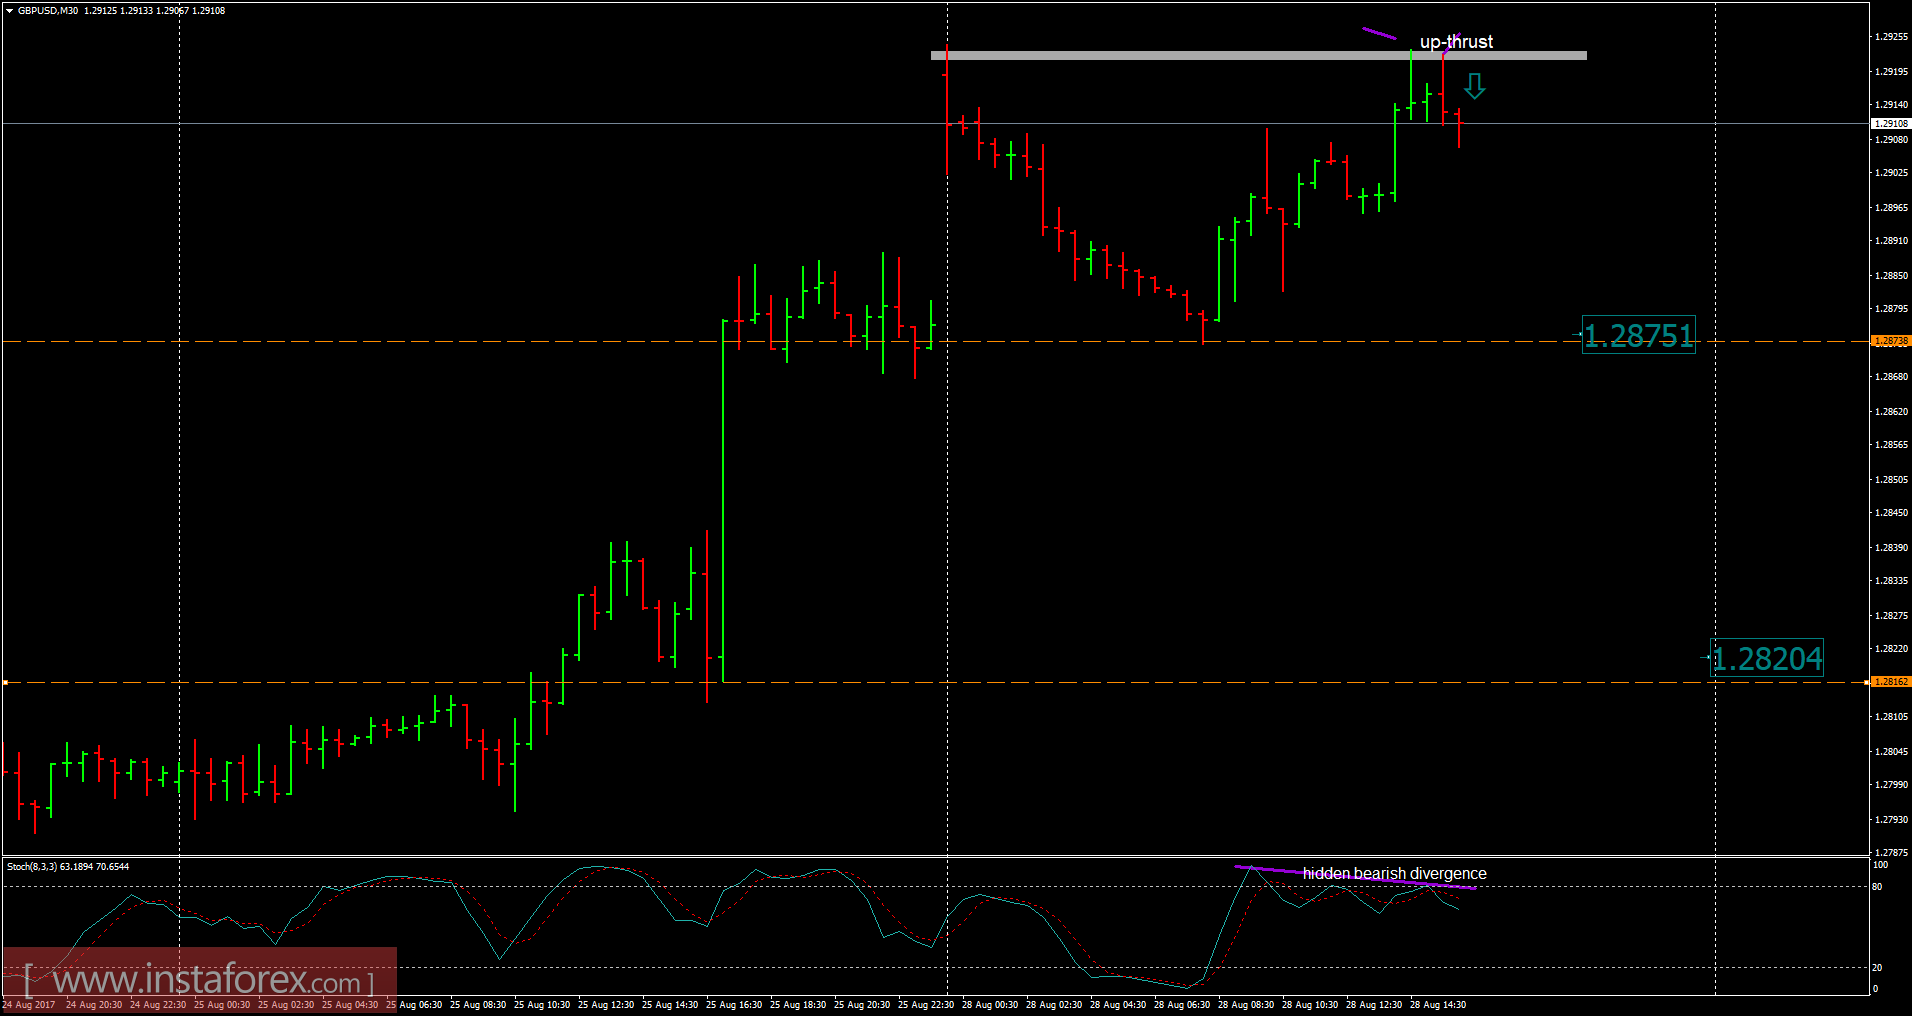
Recently, the GBP/USD has been trading upwards. The price tested the level of 1.2923. According to the 30M time frame, I found re-test of the previous high at the price of 1.2920, which is sign that buying looks risky. Stochstic oscilator is showing a hidden bearish divergence, which is another sign of weakness. My advice is to watch for potential selling opportunities. The downward targets are set at the price of 1.2875 and 1.2820.
Resistance levels:
R1: 1.2920
R2: 1.2935
R3: 1.2945
Support levels:
S1: 1.2895
S2: 1.2885
S3: 1.2870
Trading recommendations for today: watch for potential selling opportunities.