 English
  Русский
 Bahasa Indonesia
 Bahasa Malay
 ไทย
ไทย Español
 Deutsch
 Български
 Français
 Tiếng Việt
 中文
中文 বাংলা
বাংলা हिन्दी
 Čeština
 Українська
 Română

USDX recovered from recent losses and now it points to break the 200 SMA at H1 chart, which should also bring more momentum in order to reach the resistance level of 93.09. Such area could activate some kind of bearish force across the board, but if it gives up to the bulls, further gains are expected to take place towards the 93.72 level.
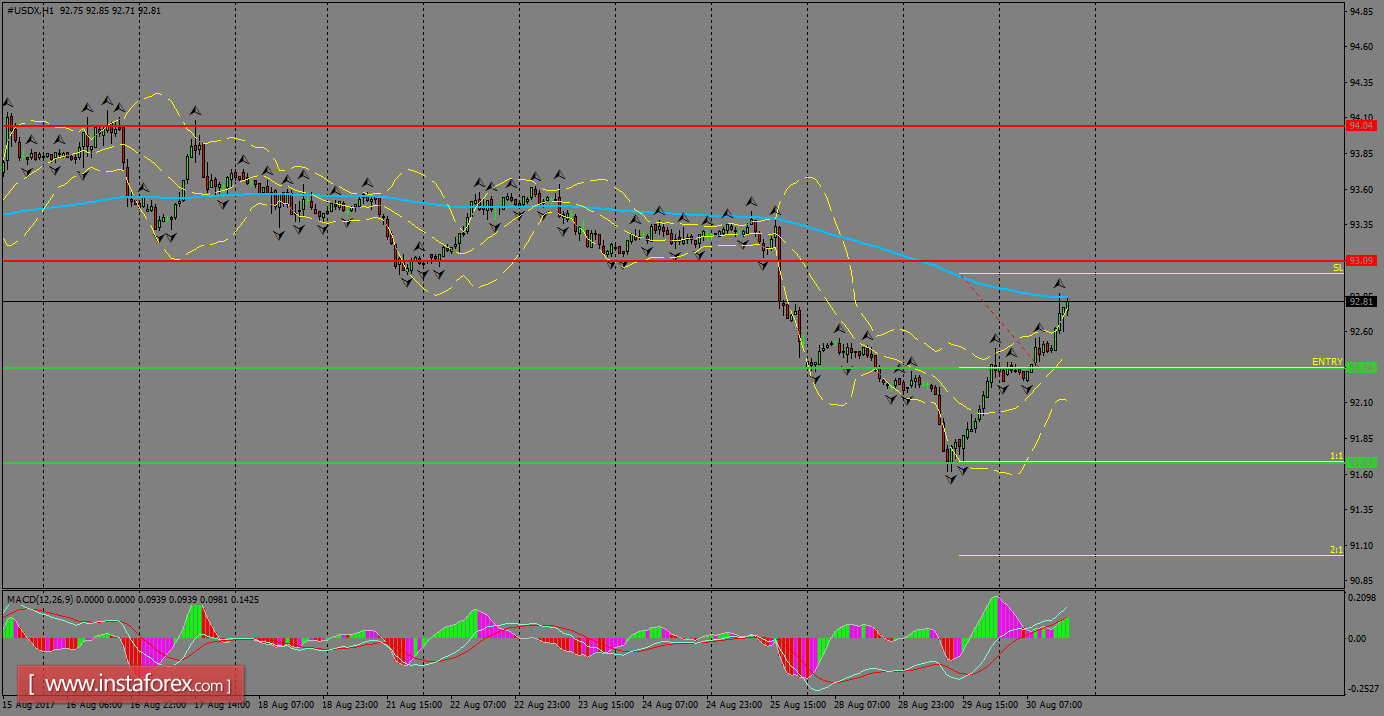
H1 chart's resistance levels: 93.09 / 93.72
H1 chart's support levels: 92.34 / 91.67
Trading recommendations for today: Based on the H1 chart, place sell (short) orders only if the USD Index breaks with a bearish candlestick; the support level is at 92.34, take profit is at 91.67 and stop loss is at 93.00.