 English
  Русский
 Bahasa Indonesia
 Bahasa Malay
 ไทย
ไทย Español
 Deutsch
 Български
 Français
 Tiếng Việt
 中文
中文 বাংলা
বাংলা हिन्दी
 Čeština
 Українська
 Română

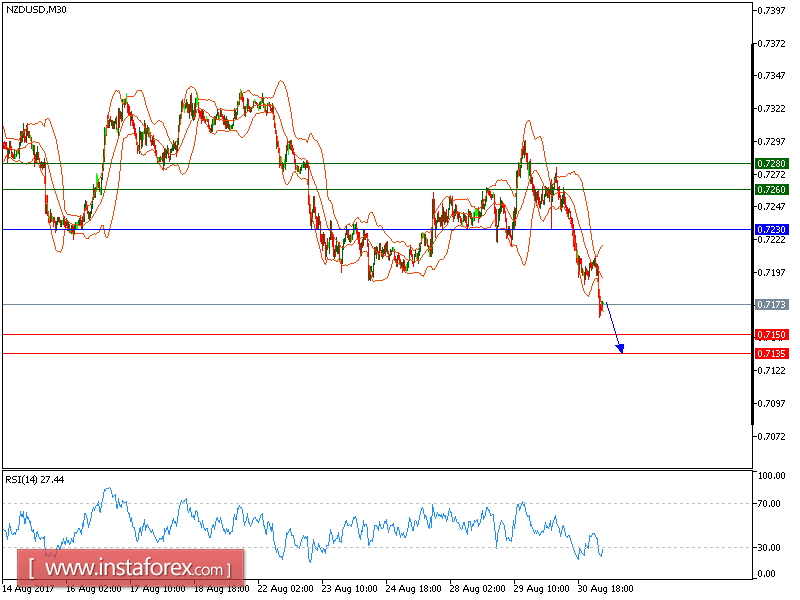
Our target which we predicted in Yesterday's analysis has been hit. The pair is still under pressure and expected to continue its downside movement. Despite the recent rebound from 0.7185, the pair is still trading below the declining 50-period moving average, which plays a resistance role. The upside potential should be limited by the key resistance at 0.7230.
Hence, as long as this key level is not surpassed, look for a further decline to 0.7150 and even to 0.7135 in extension.
The black line shows the pivot point. Currently, the price is above the pivot point, which indicates the bullish position. If it remains below the pivot point, it will indicate the short position. The red lines show the support levels and the green line indicates the resistance levels. These levels can be used to enter and exit trades.
Resistance levels: 0.7280, 0.7300, and 0.7325
Support levels: 0.7190, 0.7150, and 0.7100