 English
  Русский
 Bahasa Indonesia
 Bahasa Malay
 ไทย
ไทย Español
 Deutsch
 Български
 Français
 Tiếng Việt
 中文
中文 বাংলা
বাংলা हिन्दी
 Čeština
 Українська
 Română

The Dollar index has broken through the short-term resistance at 92.50 and as expected is heading towards 93-93.30. Short-term trend is still bearish and this bounce is considered just a correction and not a bigger reversal to the upside.
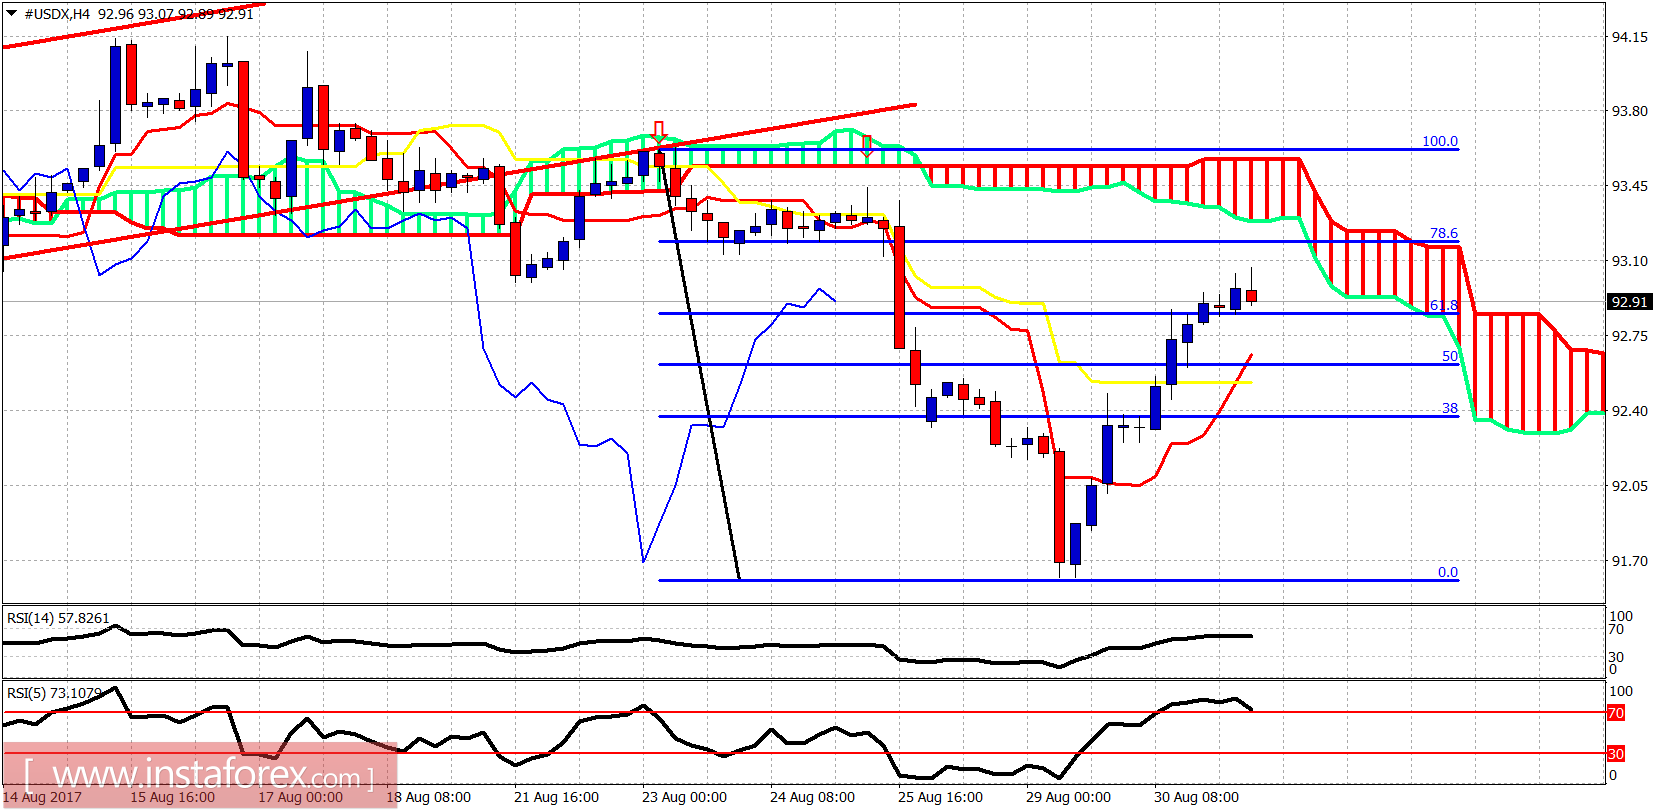
Red lines - bearish channel
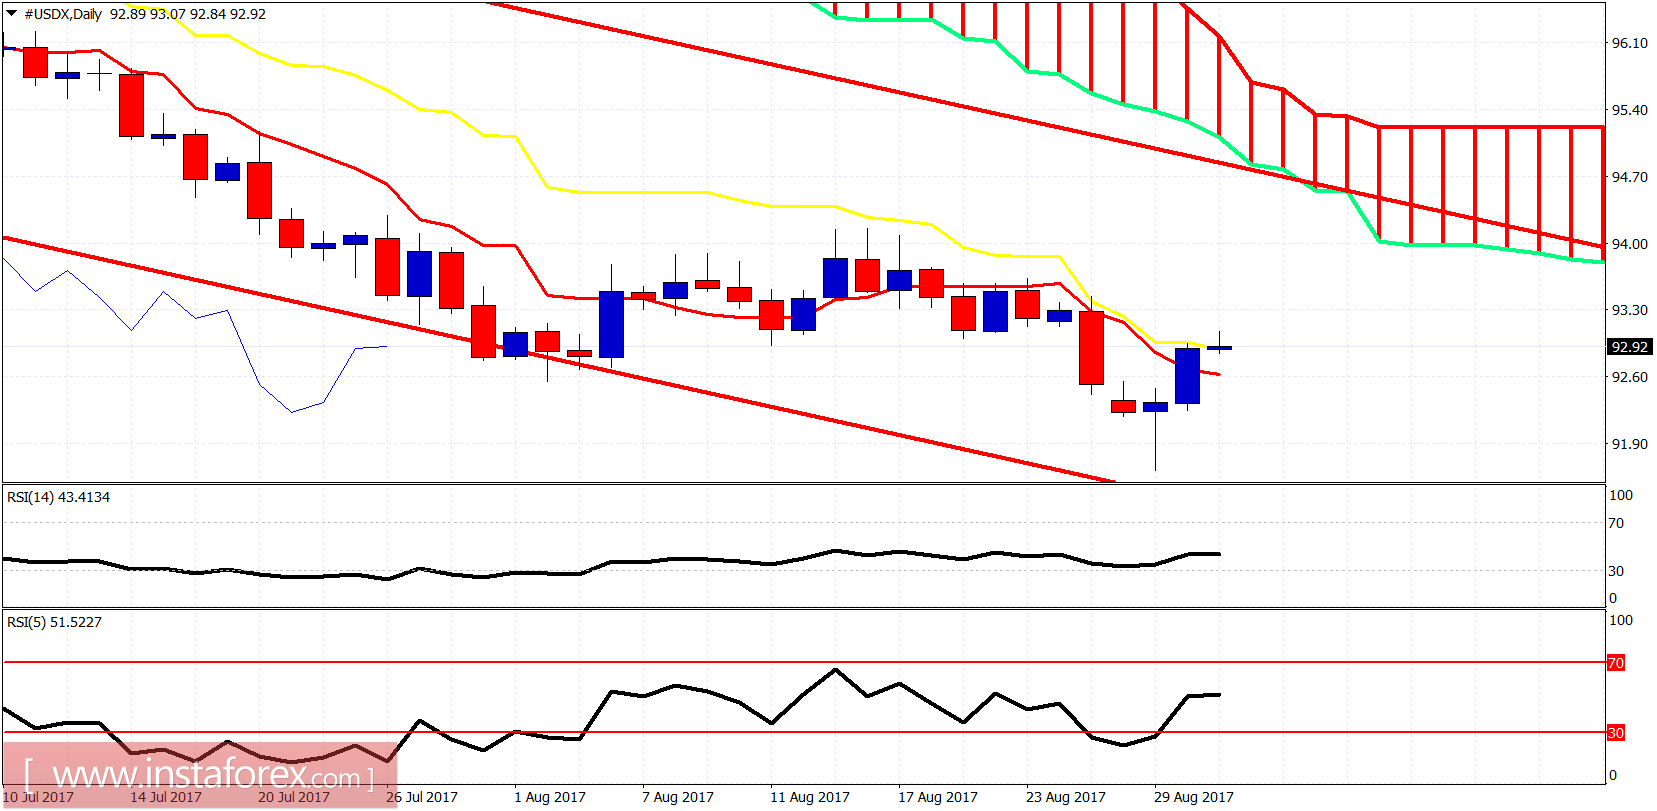
On the daily basis, price remains inside the bearish channel well below the daily Kumo (cloud). Price is trying to break above the daily kijun-sen (yellow line indicator). A rejection here is very possible. This would imply new lows ahead below 91.62. However a move above the kijun-sen will open the way for a bigger bounce towards channel and Kumo resistance at 94.