 English
  Русский
 Bahasa Indonesia
 Bahasa Malay
 ไทย
ไทย Español
 Deutsch
 Български
 Français
 Tiếng Việt
 中文
中文 বাংলা
বাংলা हिन्दी
 Čeština
 Українська
 Română

The pair still remains in a corrective mode since August 29 and looks forward to testing the support level of 1.2842. Around that area, buyers could appear for a rebound that make a breakout of the latest swing high and if that happens, we expect the price to reach the resistance zone of 1.3013, which should also strengthen the bullish scenario.
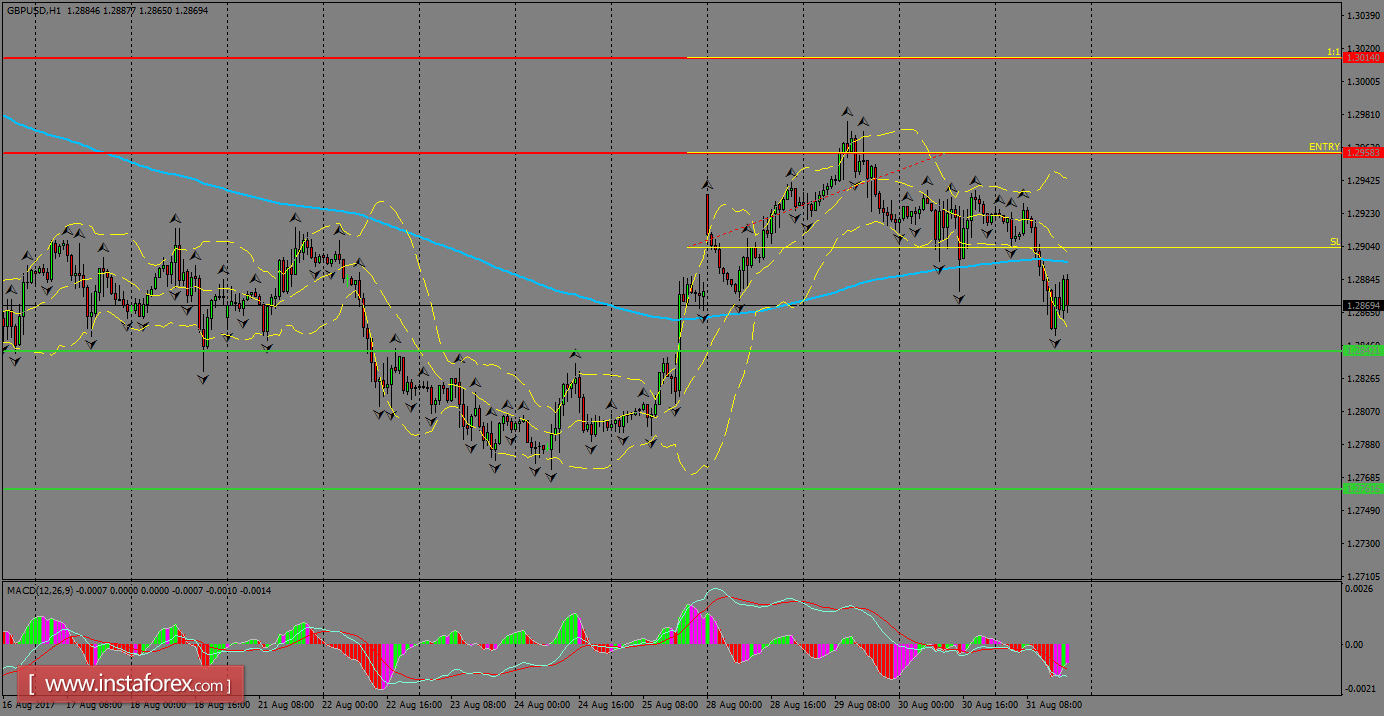
H1 chart's resistance levels: 1.2958 / 1.3013
H1 chart's support levels: 1.2842 / 1.2761
Trading recommendations for today: Based on the H1 chart, buy (long) orders only if the GBP/USD pair breaks a bullish candlestick; the resistance level is at 1.2958, take profit is at 1.3013 and stop loss is at 1.2903.