 English
  Русский
 Bahasa Indonesia
 Bahasa Malay
 ไทย
ไทย Español
 Deutsch
 Български
 Français
 Tiếng Việt
 中文
中文 বাংলা
বাংলা हिन्दी
 Čeština
 Українська
 Română

Gold price is retesting its highs. Short-term support is being held, price continues to trade inside the bullish daily channel, Ichimoku indicators still favor the bullish scenario.
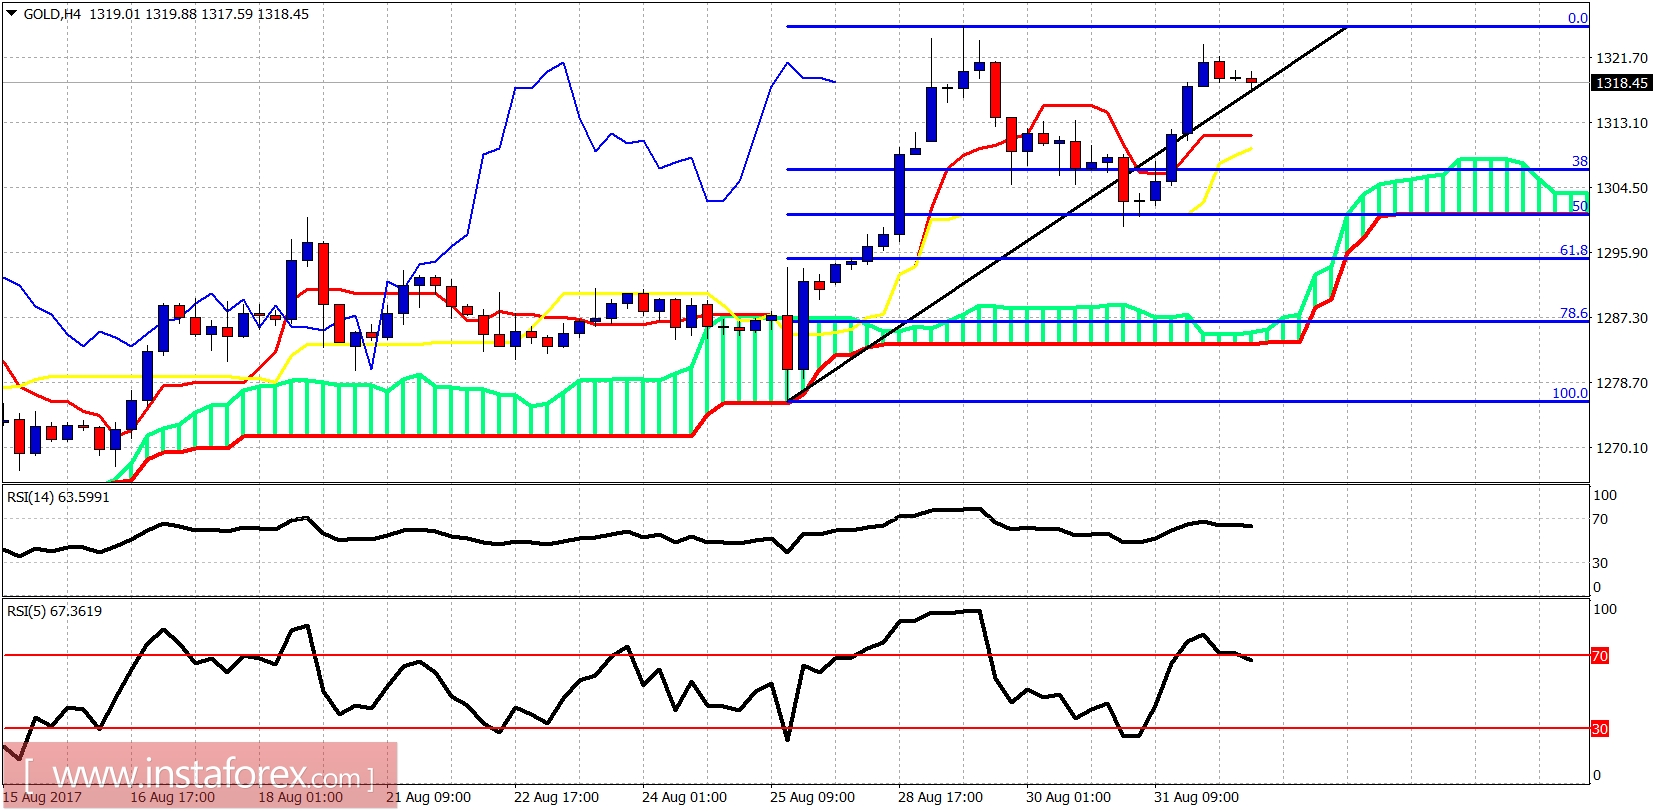
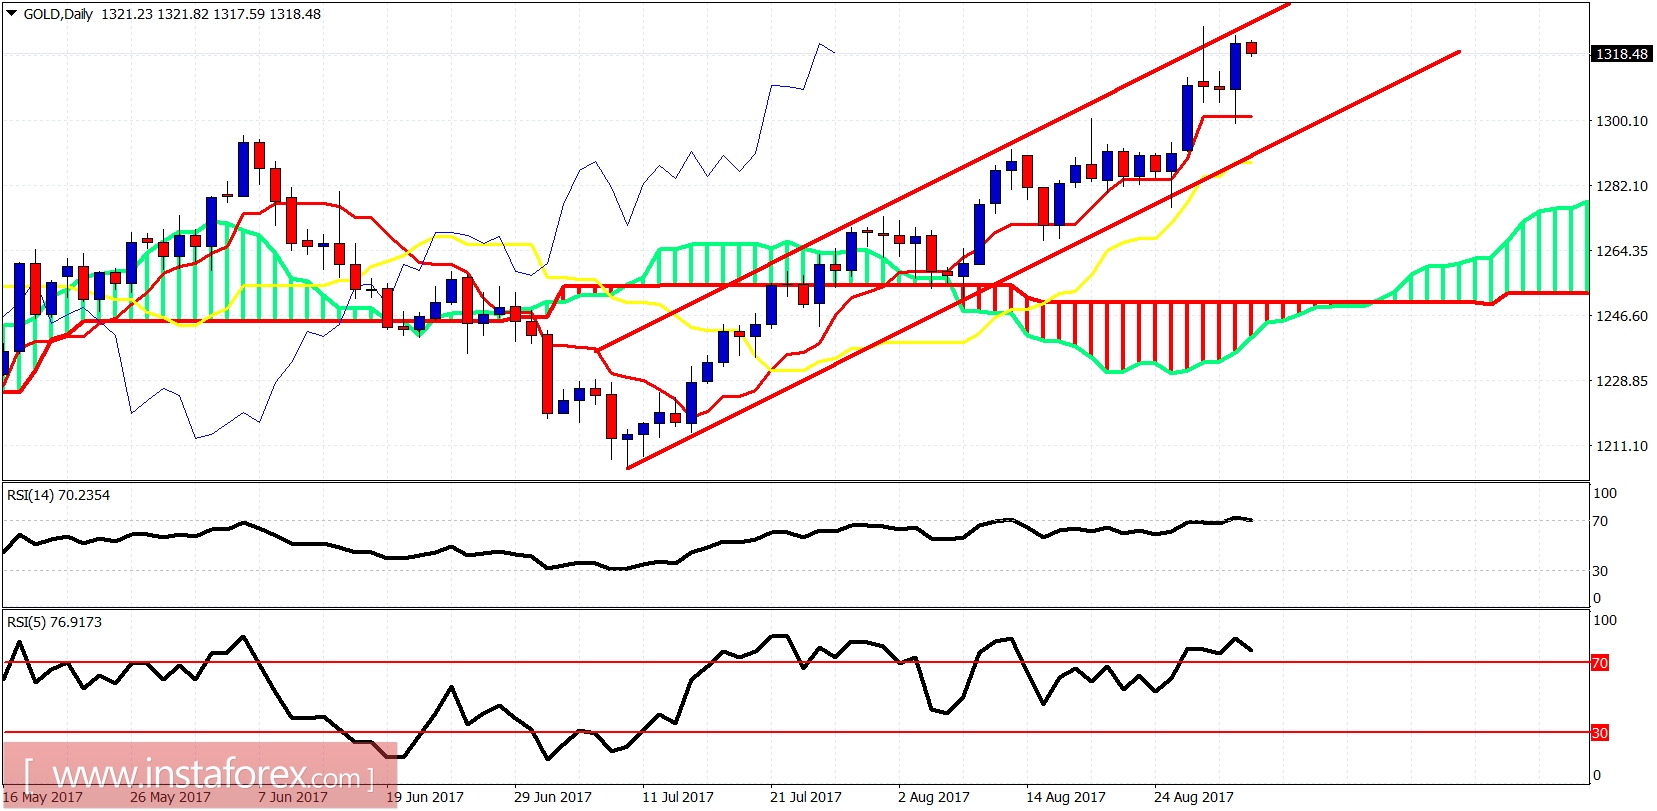
Gold price is above both the tenkan- and kijun-sen indicators on the daily chart. Price is inside the bullish channel. Daily support is at $1,300. A daily close below $1,300 could confirm a bigger correction towards $1,250-$1,280 area. Longer-term we remain bullish.