 English
 Русский
 Bahasa Indonesia
 Bahasa Malay
 ไทย
ไทย Español
 Deutsch
 Български
 Français
 Tiếng Việt
 中文
中文 বাংলা
বাংলা हिन्दी
 Čeština
 Українська
 Română


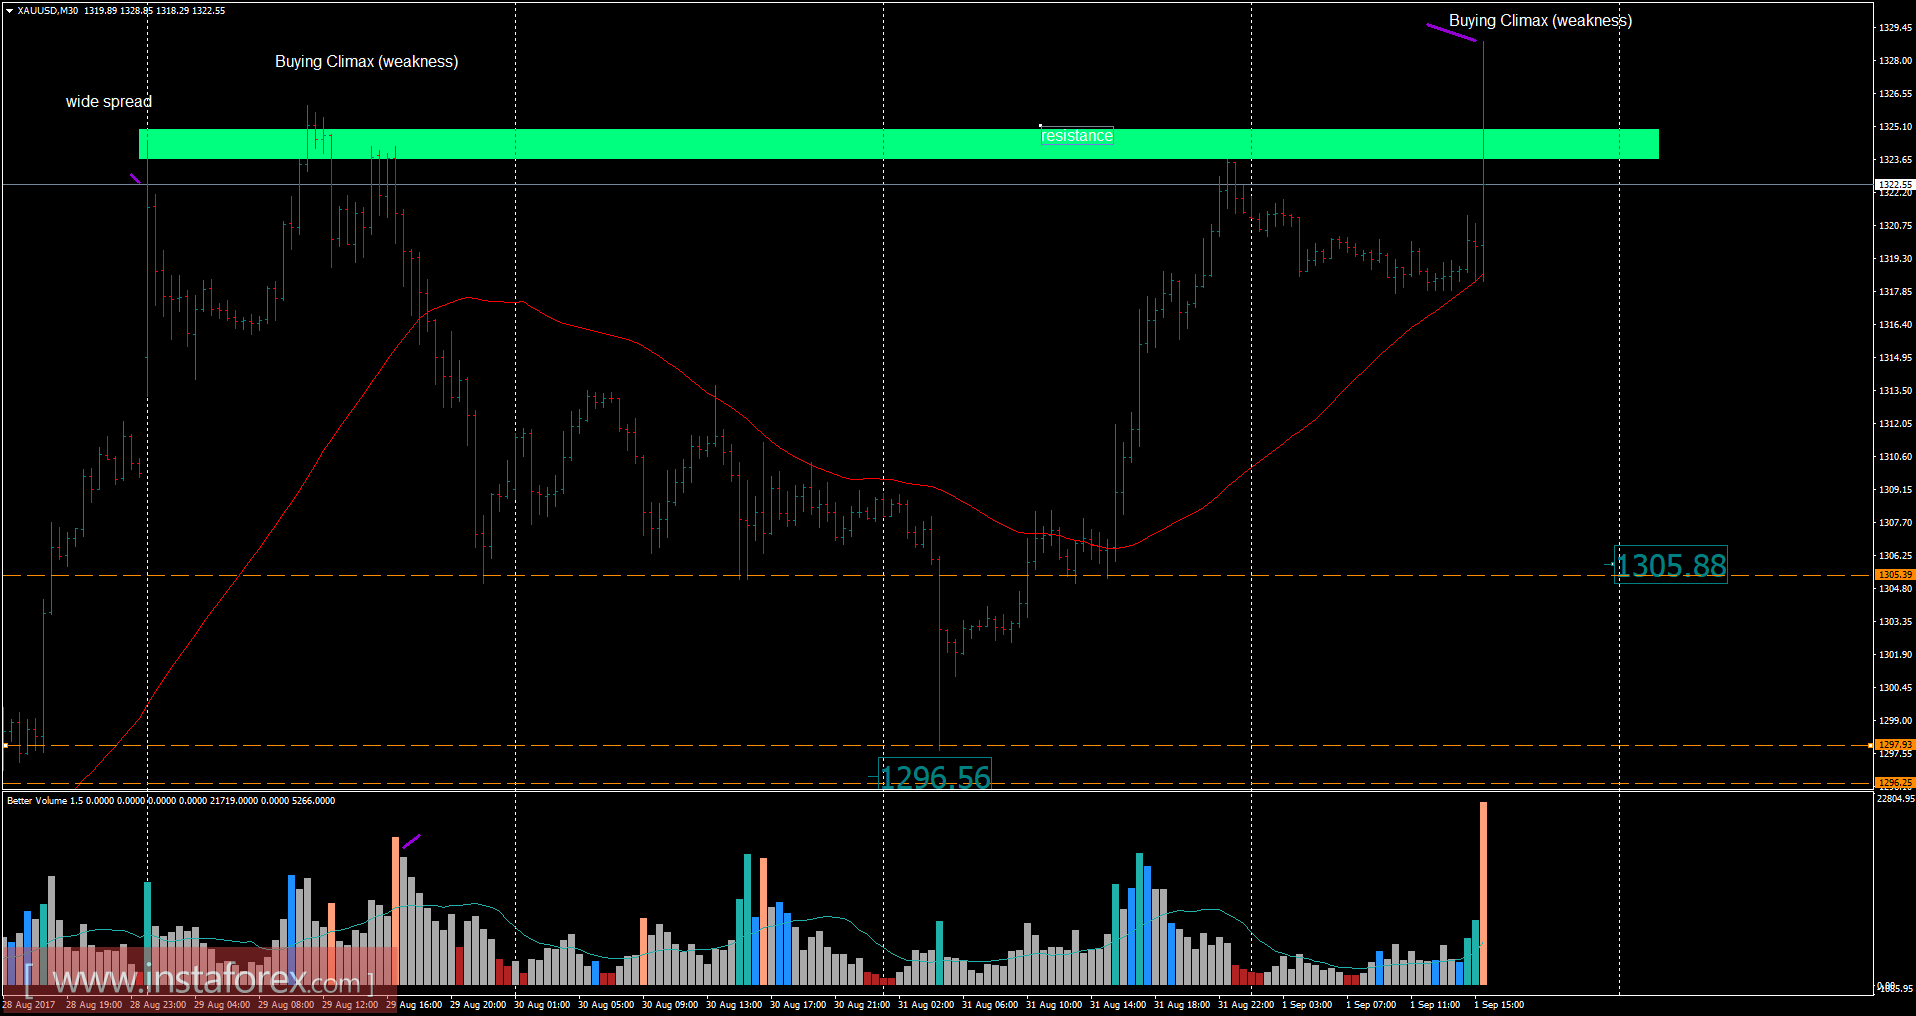
Recently, Gold has been trading upwards. The price tested the level of $1,328.85 in an ultra high volume. According to the 30M time frame, I found a wide spread bar in an ultra high volume (buying climax), which represents a strong sign of weakness. There is also a fake breakout of a resistance cluster, which is another sign of weakness. My advice is to watch for potential selling opportuntiies. The downawrd targets are set at the price of $1,315.00 and $1,305.00.
Resistance levels:
R1: $1,333.45
R2: $1.344.60
R3: $1,360.20
Support levels:
S1: $1,306.65
S2: $1,291.00
S3: $1,279.95
Trading recommendations for today: watch for potential selling opportunities.