 English
  Русский
 Bahasa Indonesia
 Bahasa Malay
 ไทย
ไทย Español
 Deutsch
 Български
 Français
 Tiếng Việt
 中文
中文 বাংলা
বাংলা हिन्दी
 Čeština
 Українська
 Română

Gold price remains in a bullish trend. Price is approaching medium-term resistance at $1,350 where we could see a larger pullback towards $1,300 or lower. There are still no bearish divergence signs of importance. Longer-term view remains bullish.
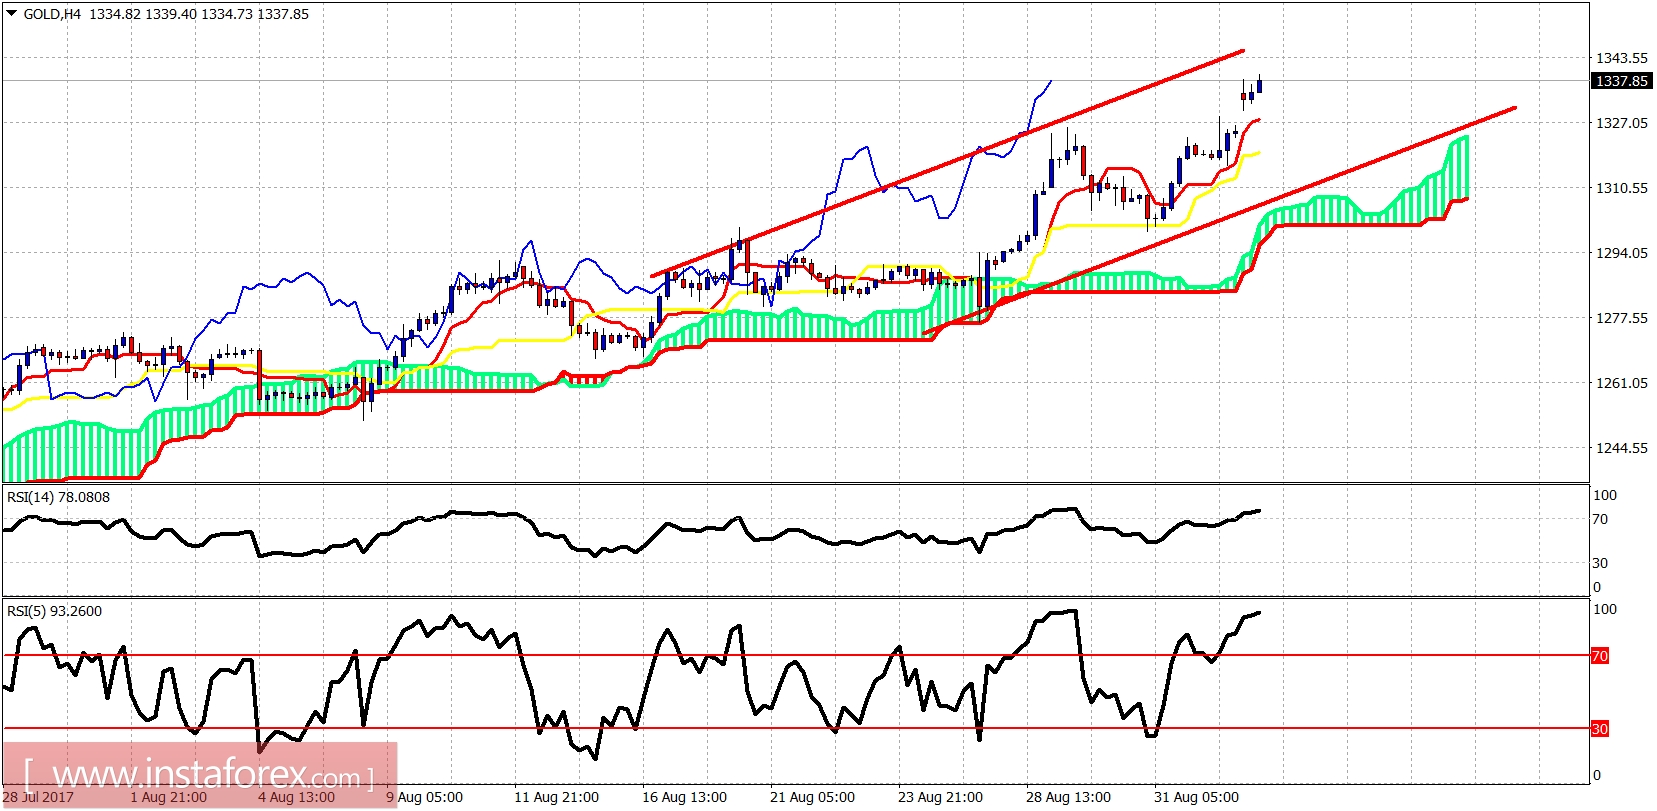
Red lines - bullish channel
Gold price is trading above both the tenkan- and kijun-sen indicators. Price is making higher highs and higher lows. Support is at $1,327-20. Resistance is at $1,350.
Blue line - support trend line
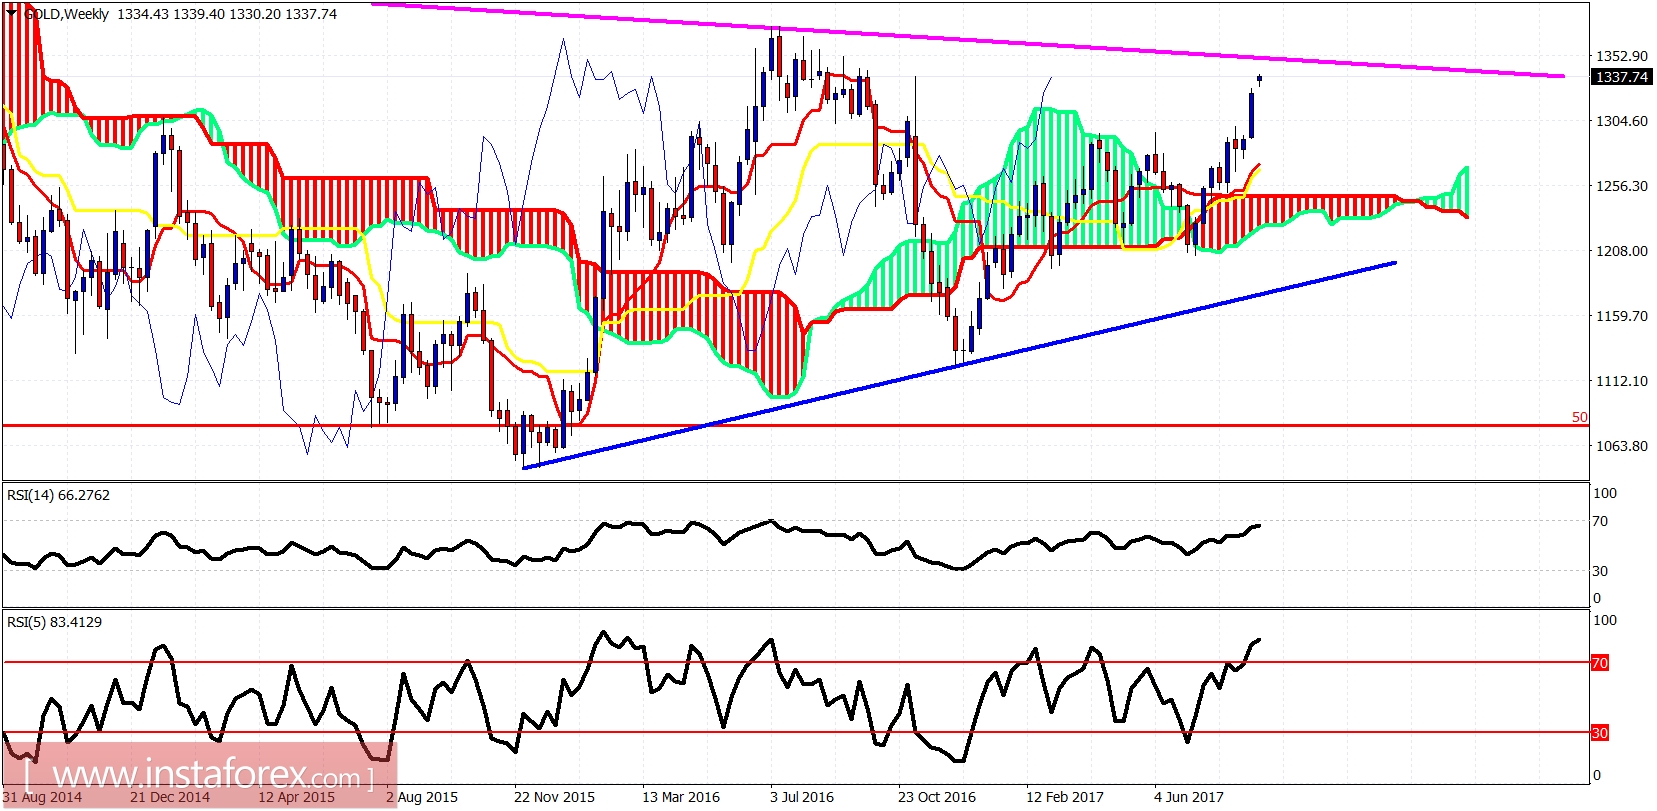
Gold price is heading towards the magenta trend line resistance. This $1,350 target is our next target after our minimum expectation of $1,320 was achieved. A pullback towards $1,260-$1,290 is possible over the coming weeks but there is no reversal sign yet. I remain longer-term bullish.