 English
  Русский
 Bahasa Indonesia
 Bahasa Malay
 ไทย
ไทย Español
 Deutsch
 Български
 Français
 Tiếng Việt
 中文
中文 বাংলা
বাংলা हिन्दी
 Čeština
 Українська
 Română

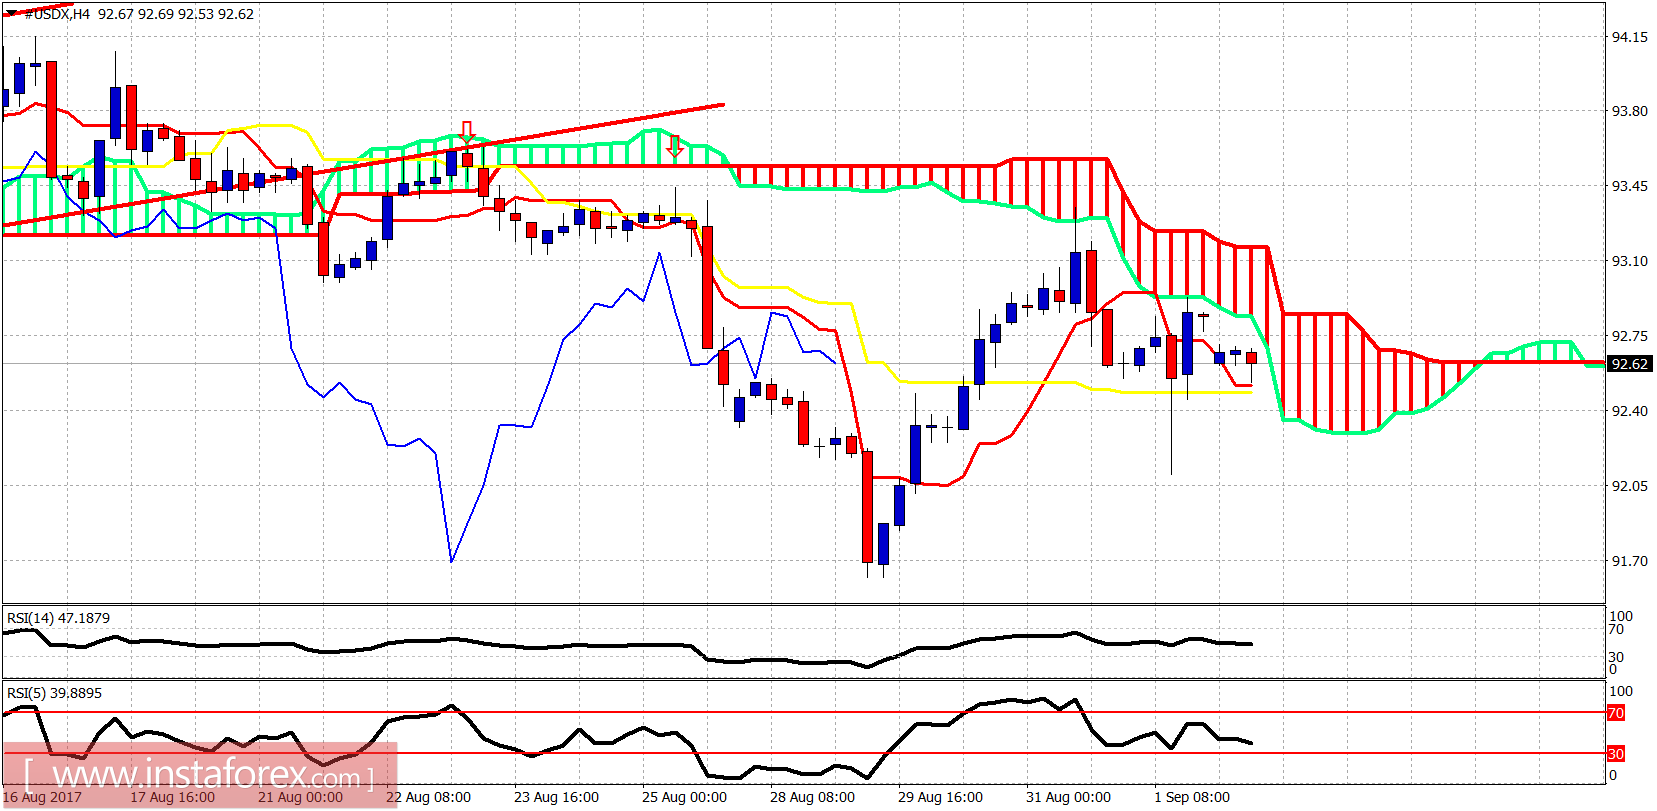
The Dollar index had a volatile Friday after the NFP announcement. Initial heavy selling pressures were faded and price bounced back to pre- NFP levels, however trend remains bearish as the index continues to trade below Ichimoku cloud resistance.
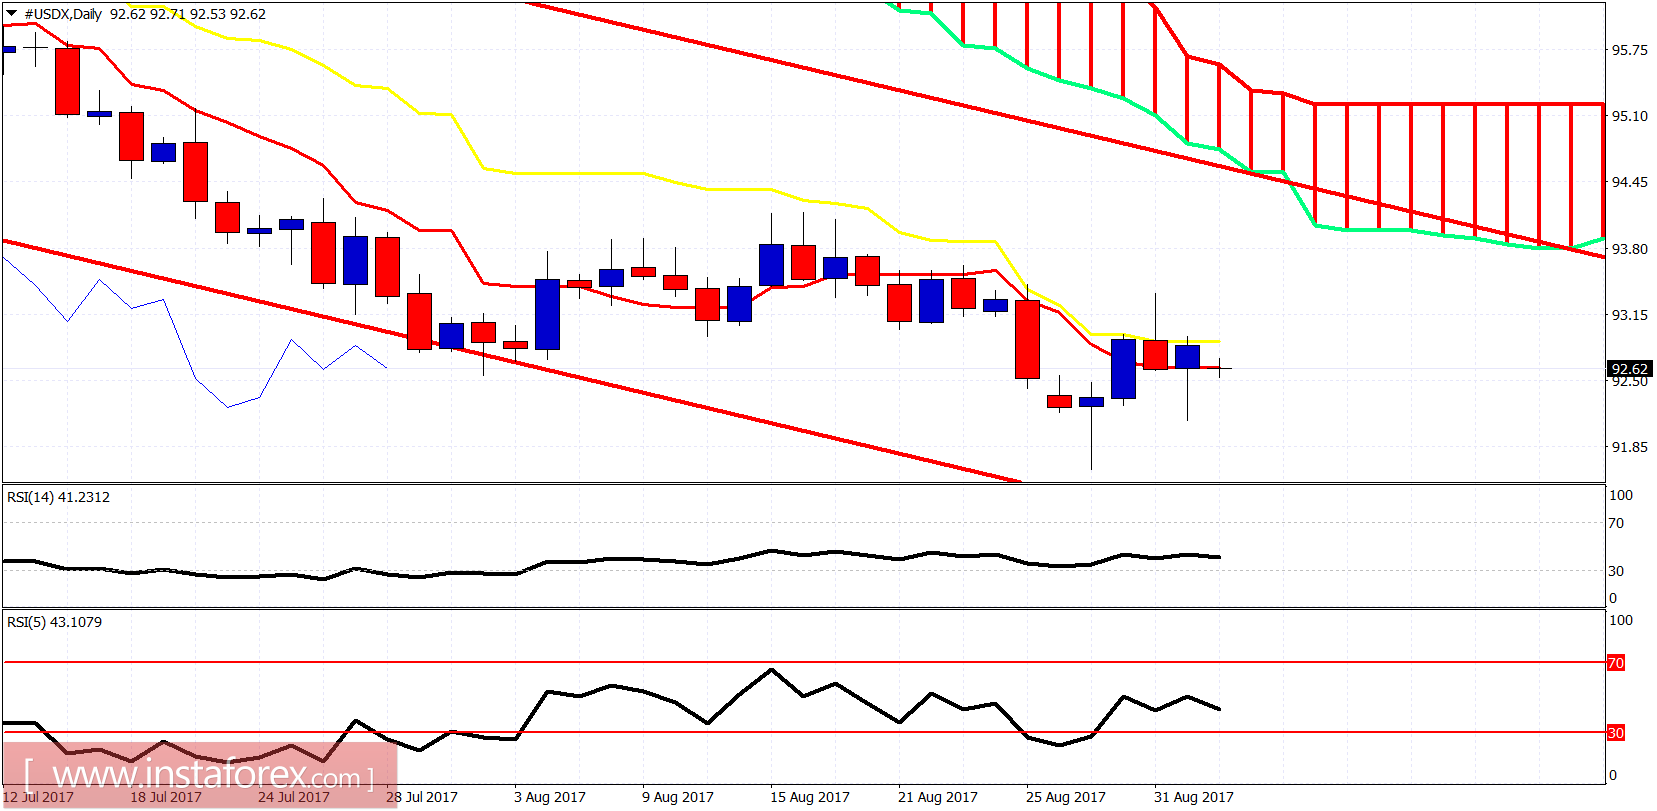
On a daily basis trend remains bearish. Price is still below the daily kijun-sen (yellow line indicator). Price is trying to hold above the daily tenkan-sen (red line indicator). A break above 93-93.10 will open the way for a bounce towards 94-94.30. A move towards the 90 level is what I expect next. But we may see 94 first. Key support is at 92.10.