 English
  Русский
 Bahasa Indonesia
 Bahasa Malay
 ไทย
ไทย Español
 Deutsch
 Български
 Français
 Tiếng Việt
 中文
中文 বাংলা
বাংলা हिन्दी
 Čeština
 Українська
 Română

Gold price is moving sideways in the intraday chart. Medium and longer-term trend remains bullish and we continue to see a move above $1,400 over the coming months. However there are increased chances of a Gold pullback over the next 1-2 weeks towards $1,300.
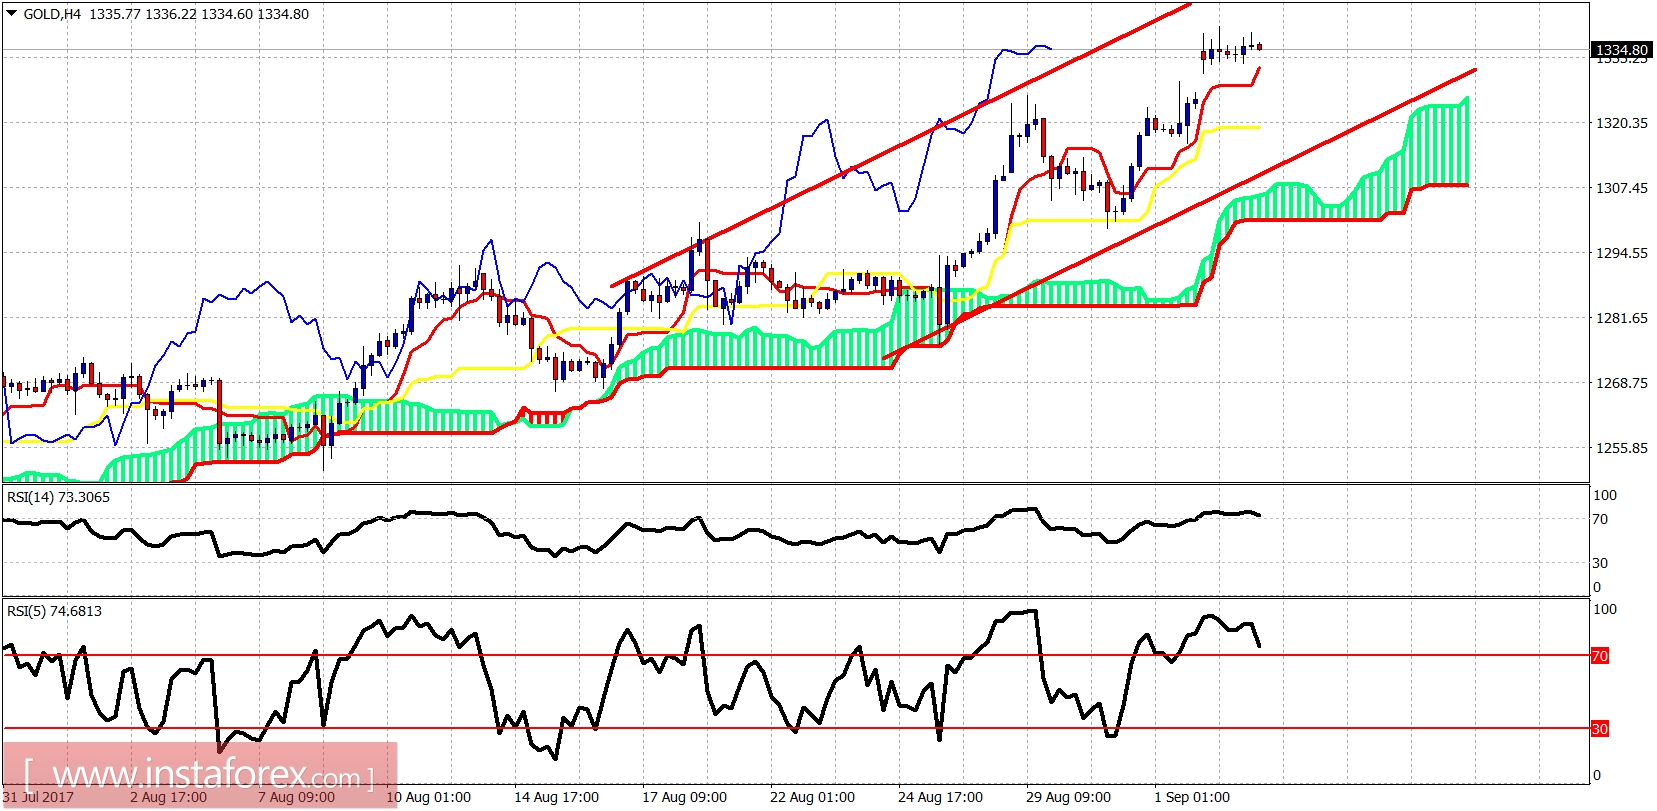
In the short term, price is clearly bullish. There are some topping signs by the oscillators that provide a short-term warning for bulls. We could see a 10-30$ decline soon. Support is at $1.331 and the next at $1,320.
Blue line - support
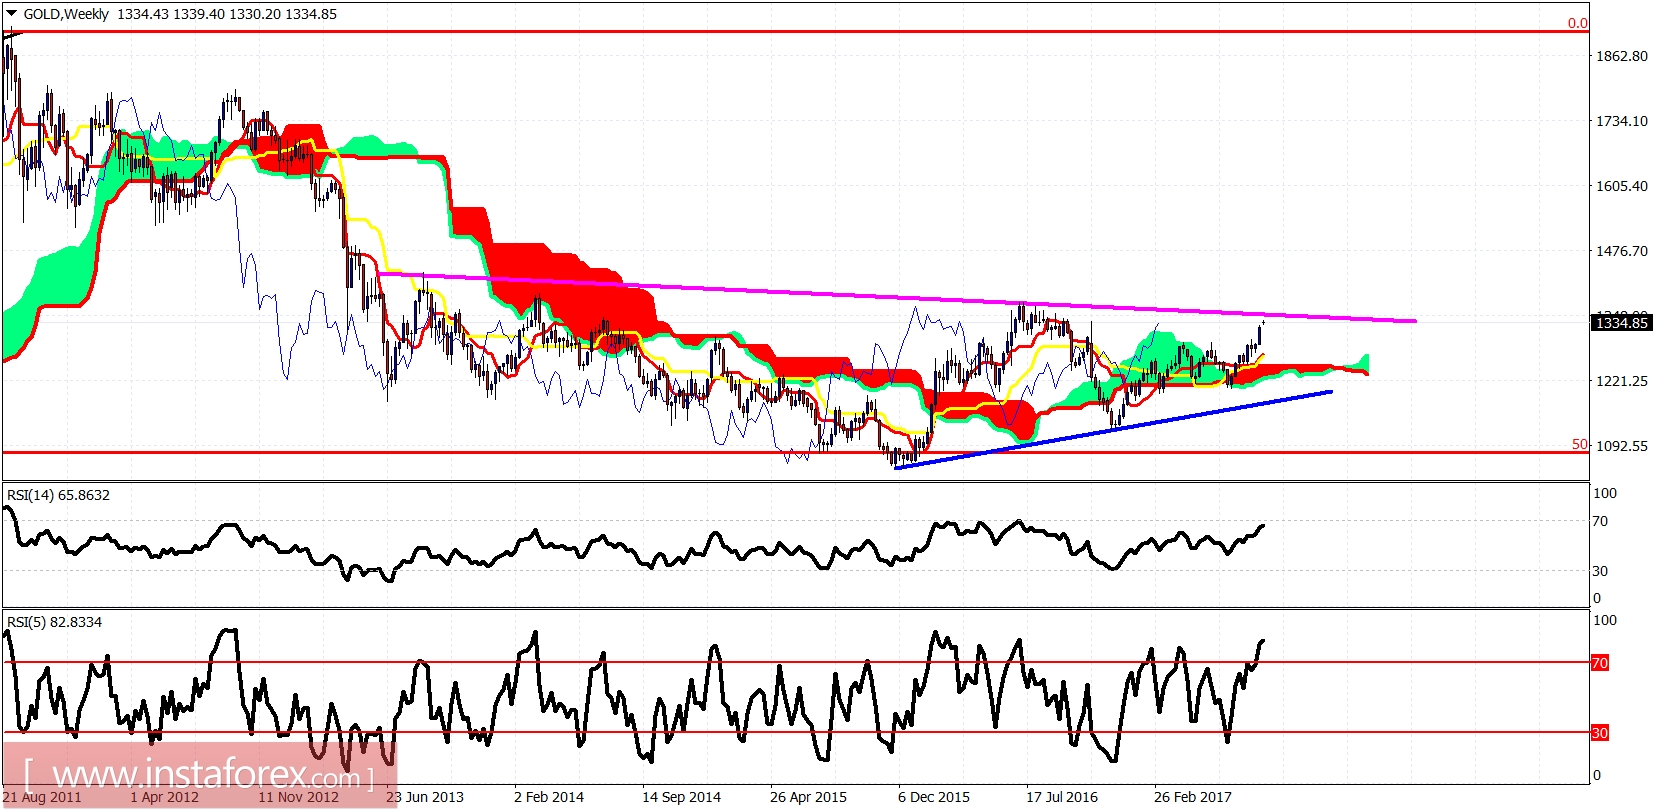
On a weekly basis, we are in a bullish break out above the weekly Kumo. Technical resistance is at $1,350 by the magenta trend line. I expect the Gold price to reach and most probably break the resistance trend line. I do not expect price to move back below the weekly Kumo, although a pullback is possible. I do not trade pullbacks, pullbacks are buying opportunities.