 English
  Русский
 Bahasa Indonesia
 Bahasa Malay
 ไทย
ไทย Español
 Deutsch
 Български
 Français
 Tiếng Việt
 中文
中文 বাংলা
বাংলা हिन्दी
 Čeština
 Українська
 Română

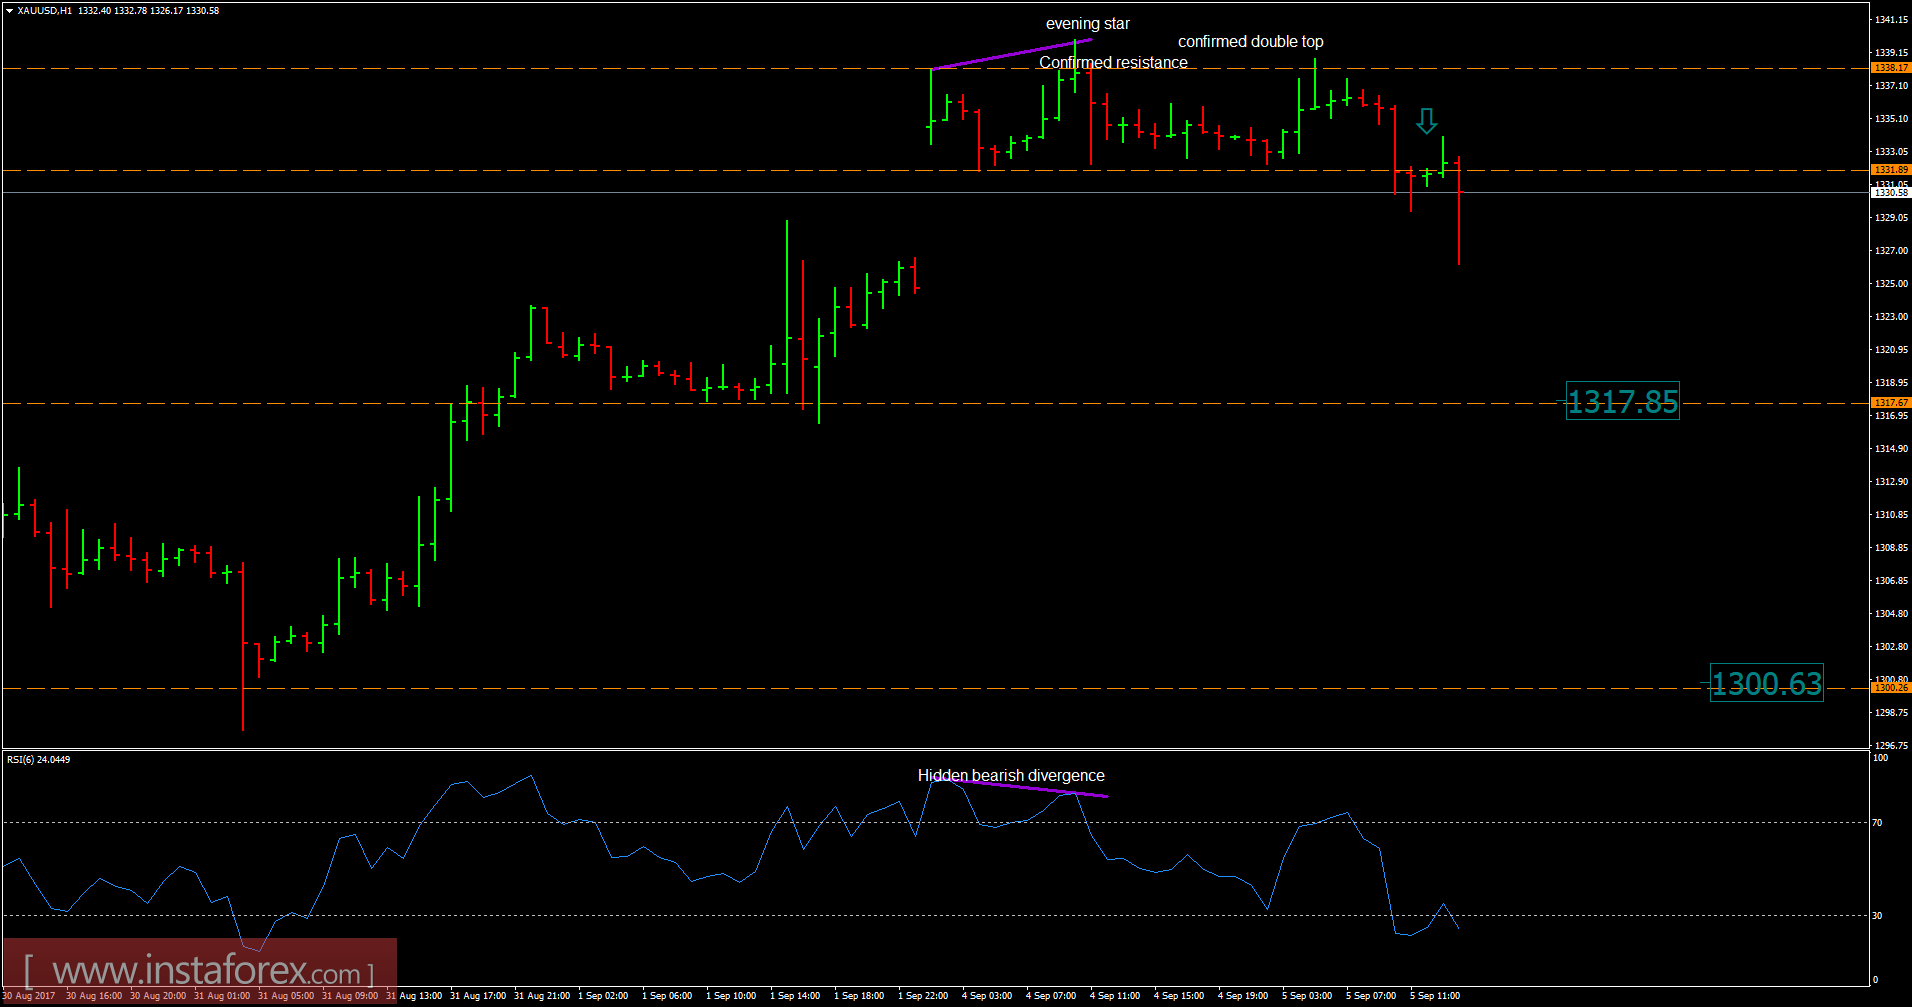
Recently, Gold has been trading downwards. As I expected, the price tested the level of $1,326.17. According to the 1H time frame, I found a confirmed double top formation, an evening star candle formation and hidden bearish divergence on the RSI oscilator, which are signs that buying looks risky and that sellers took control from buyers. My advice is to watch for potential selling opportunties. The downward targets are set at the price of $1,317.15 and $1,300.65
Resistance levels:
R1: $1,342.75
R2: $1,347.50
R3: $1,350.50
Support levels:
S1: $1,335.20
S2: $1,332.40
S3: $1,327.60
Trading recommendations for today: watch for potential selling opportunities.