 English
  Русский
 Bahasa Indonesia
 Bahasa Malay
 ไทย
ไทย Español
 Deutsch
 Български
 Français
 Tiếng Việt
 中文
中文 বাংলা
বাংলা हिन्दी
 Čeština
 Українська
 Română

GBP/USD has rallied as we expected and it found dynamic support around the 200 SMA at H1 chart. Currently, it's challenging the resistance zone of 1.3013 and a break over there should expose the next key psychological level of 1.3100 in the short-term. To the downside, a new support has been formed around 1.2958. MACD indicator remains in the positive territory.
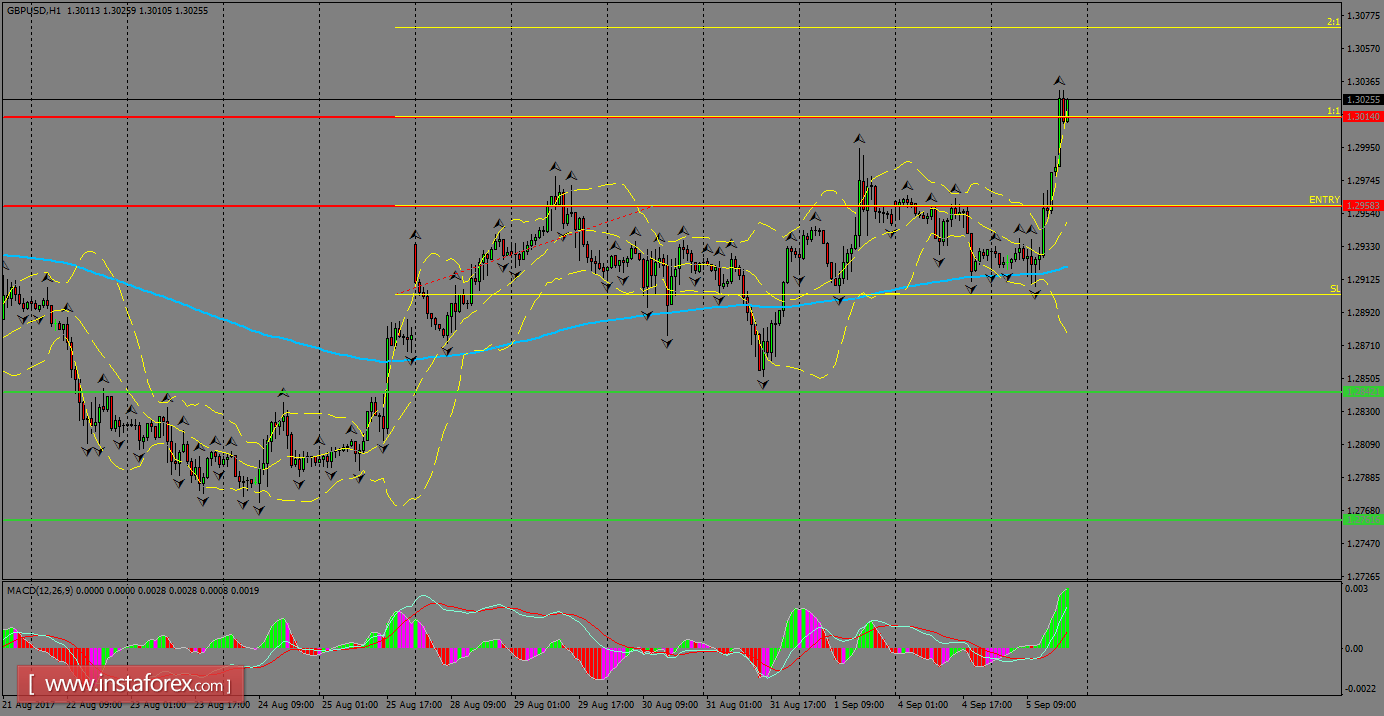
H1 chart's resistance levels: 1.2958 / 1.3013
H1 chart's support levels: 1.2842 / 1.2761
Trading recommendations for today: Based on the H1 chart, buy (long) orders only if the GBP/USD pair breaks a bullish candlestick; the resistance level is at 1.2958, take profit is at 1.3013 and stop loss is at 1.2903.