 English
  Русский
 Bahasa Indonesia
 Bahasa Malay
 ไทย
ไทย Español
 Deutsch
 Български
 Français
 Tiếng Việt
 中文
中文 বাংলা
বাংলা हिन्दी
 Čeština
 Українська
 Română

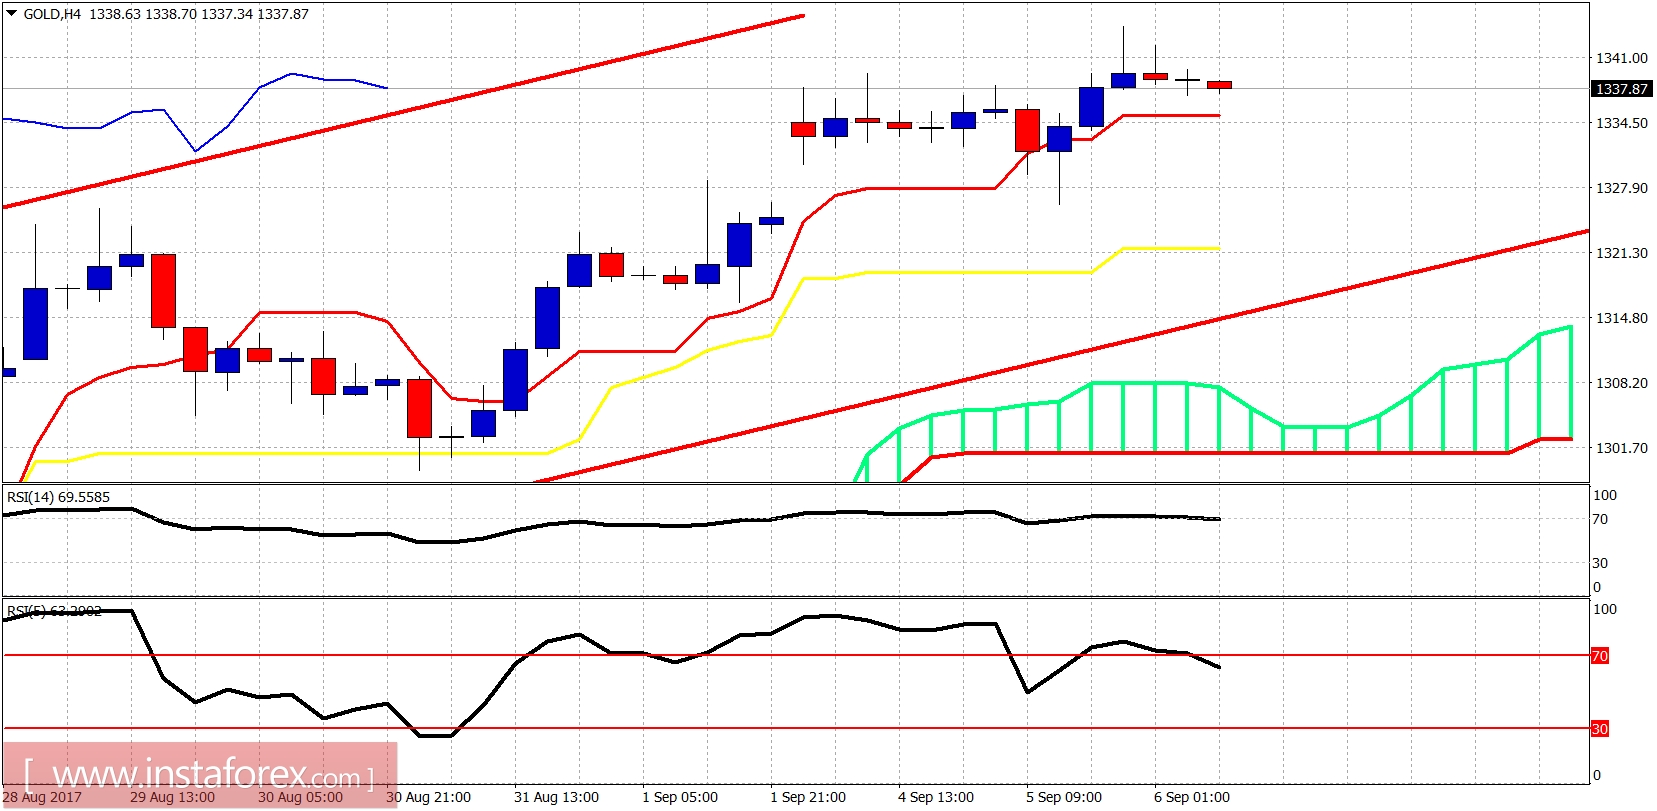
Gold price is very close to our second target of $1,350. Trend is bullish but also fragile for a pullback towards $1,300. Longer-term view remains bullish targeting above $1,400.
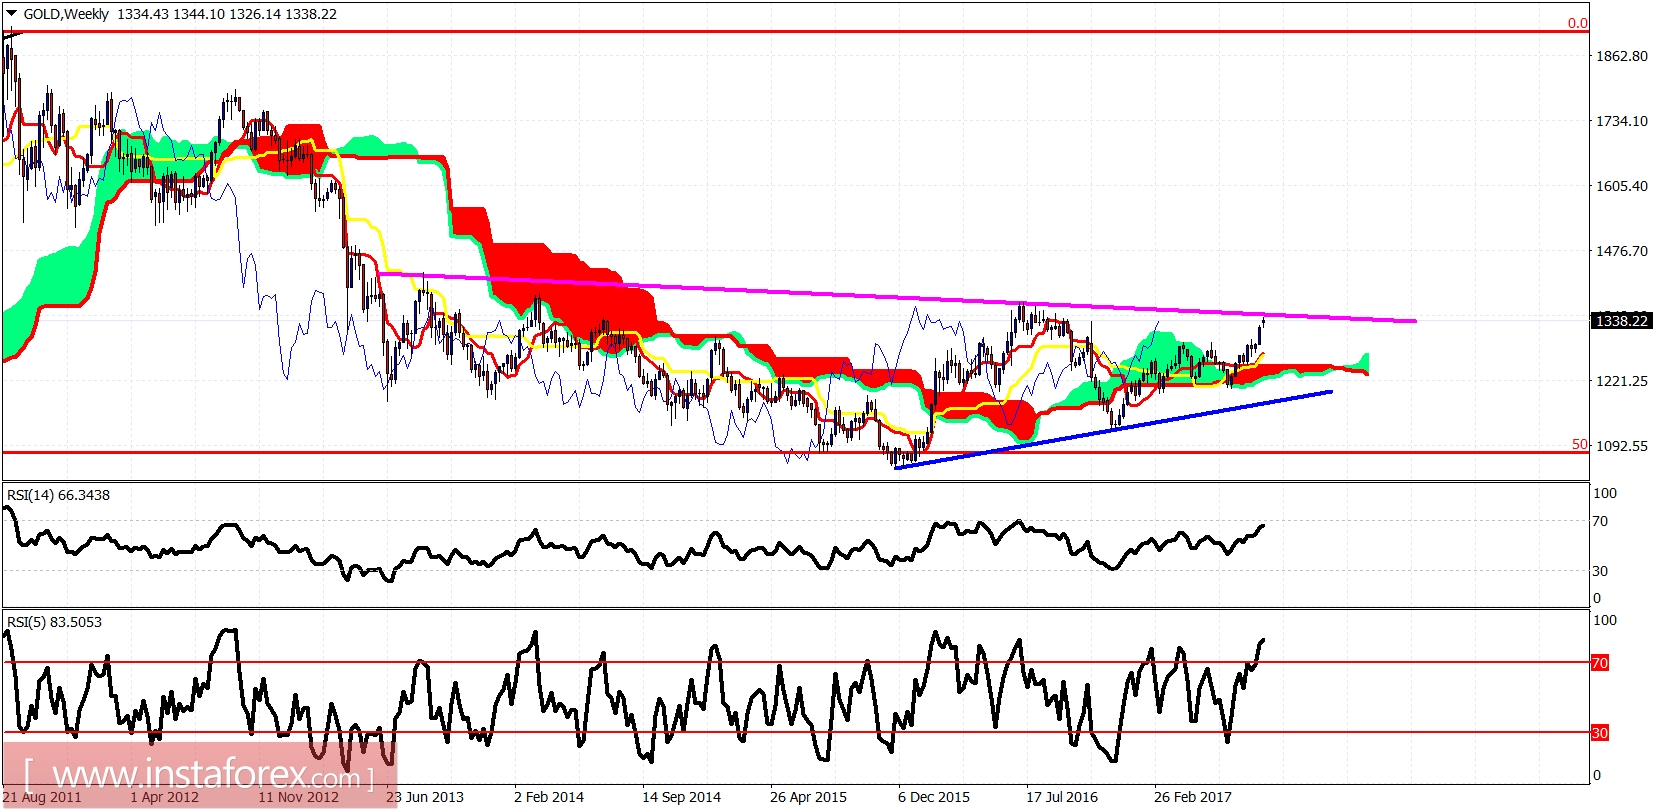
Blue line -long-term support
Gold price is above the weekly Kumo and with RSI (5) making new highs. Trend is clearly bullish on a weekly basis and we have a short-term target of $1,350 after our first at $1,320 was achieved. A pullback towards $1,300 is possible before the break out towards $1,400. Longer-term view remains bullish.