 English
  Русский
 Bahasa Indonesia
 Bahasa Malay
 ไทย
ไทย Español
 Deutsch
 Български
 Français
 Tiếng Việt
 中文
中文 বাংলা
বাংলা हिन्दी
 Čeština
 Українська
 Română

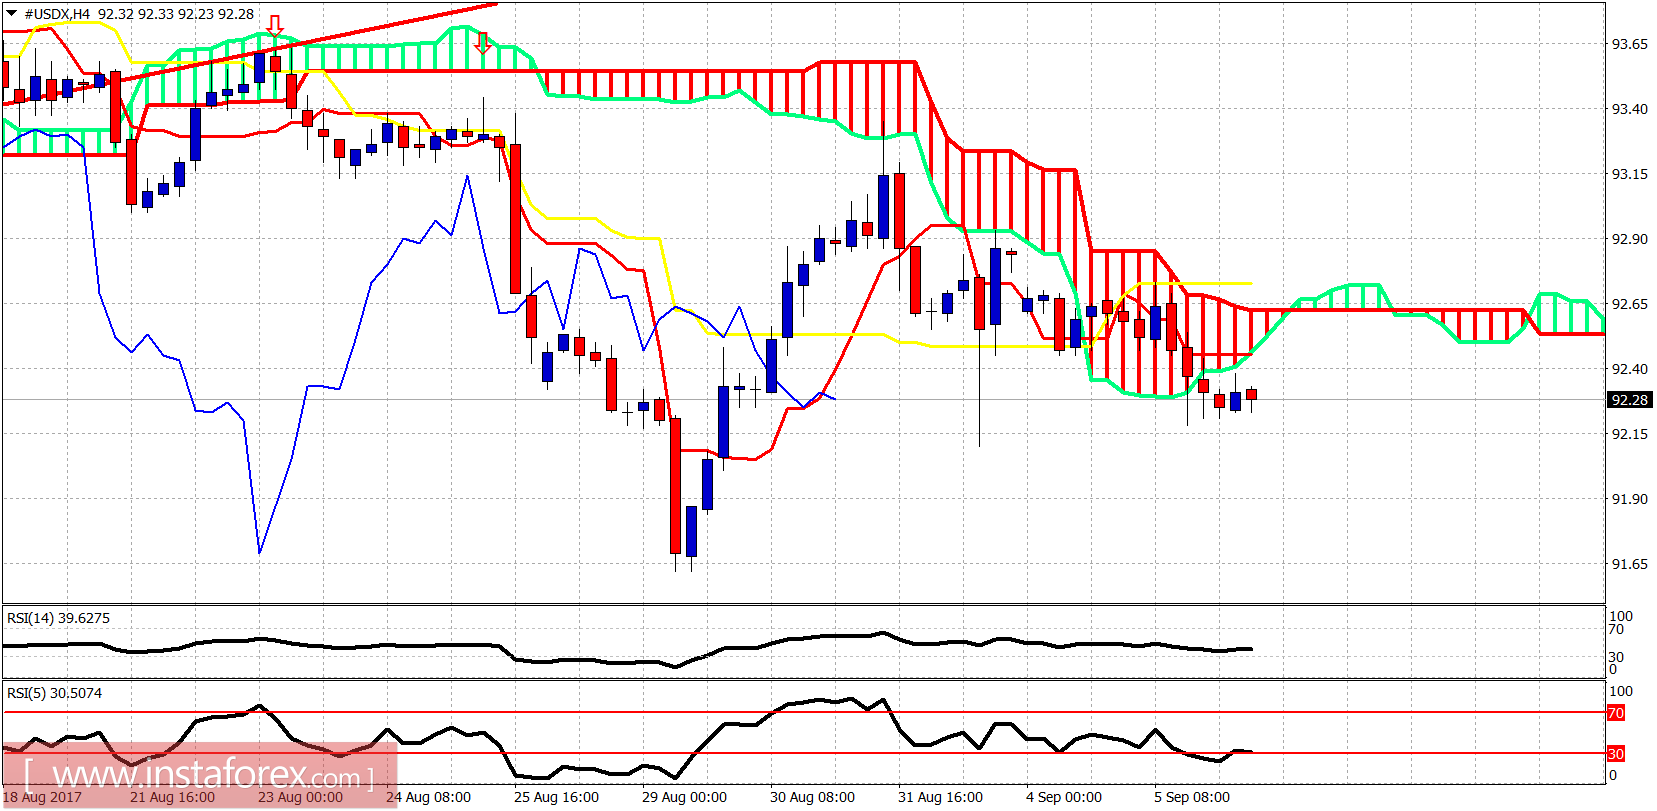
The Dollar index tried to break out of the 4-hour Kumo resistance yesterday and change short-term trend to bullish, but it got rejected and has now broken below Ichimoku cloud support once again.
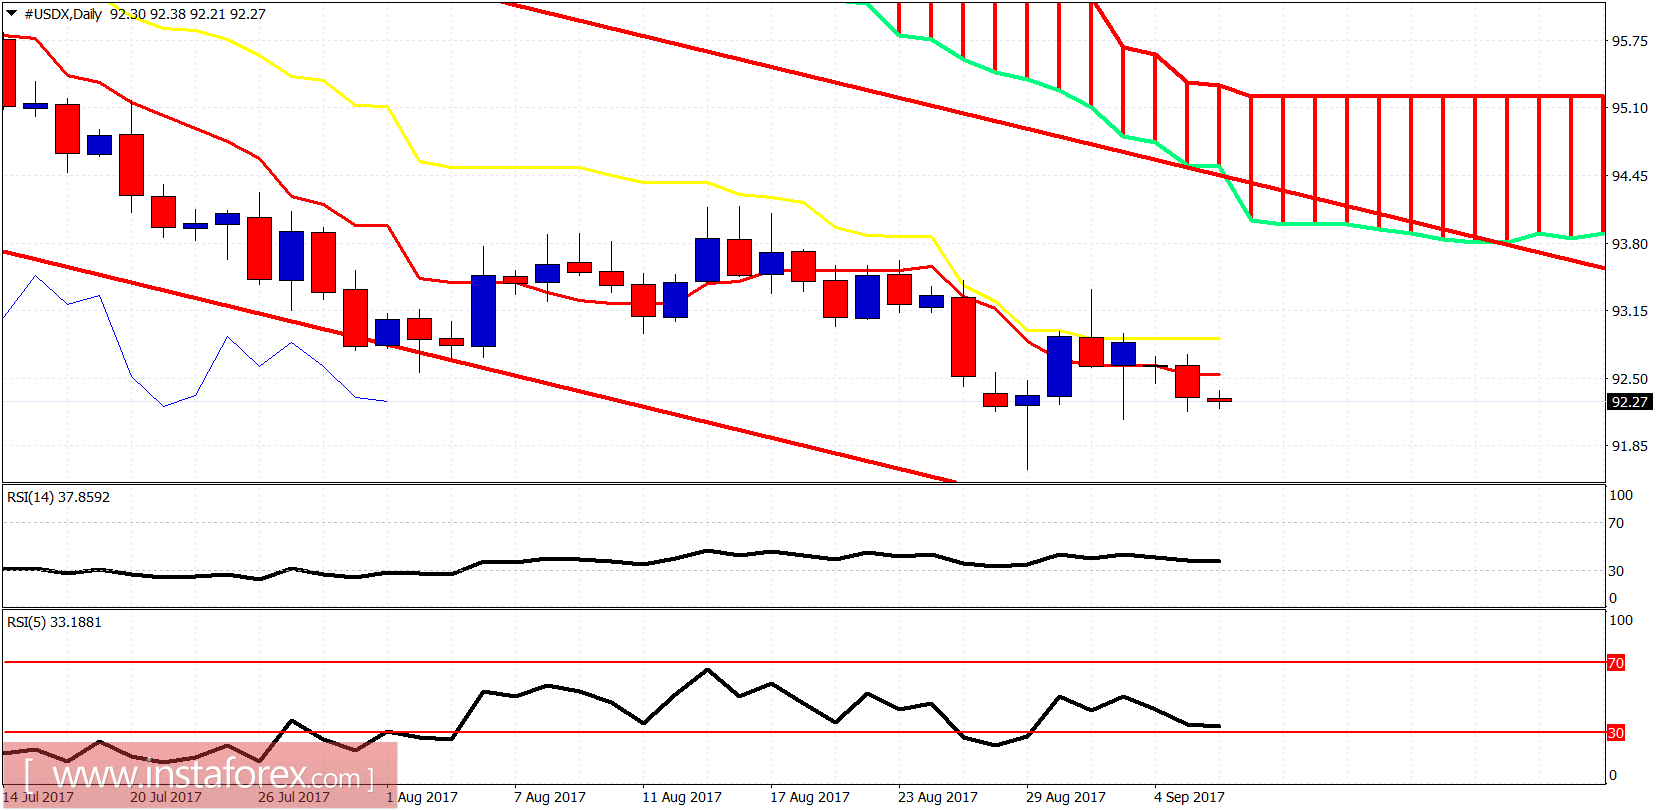
On a daily basis, trend is bearish. Price broke below the tenkan-sen yesterday. This is not a good sign for Dollar bulls. Daily resistance is between 92.55-92.90. As long as price is below this area on a daily basis, we will be waiting for new lows. Break this resistance and we move towards 94.