 English
  Русский
 Bahasa Indonesia
 Bahasa Malay
 ไทย
ไทย Español
 Deutsch
 Български
 Français
 Tiếng Việt
 中文
中文 বাংলা
বাংলা हिन्दी
 Čeština
 Українська
 Română

The pair has been consolidating gains above the support level of 1.2976 and looks forward to consolidating above the resistance zone of 1.3073. The 200 SMA at H1 chart still offers dynamic support across the board and one could expect some corrective moves before to continue with the rallies. MACD indicator is entering the positive territory, favoring to the bulls.
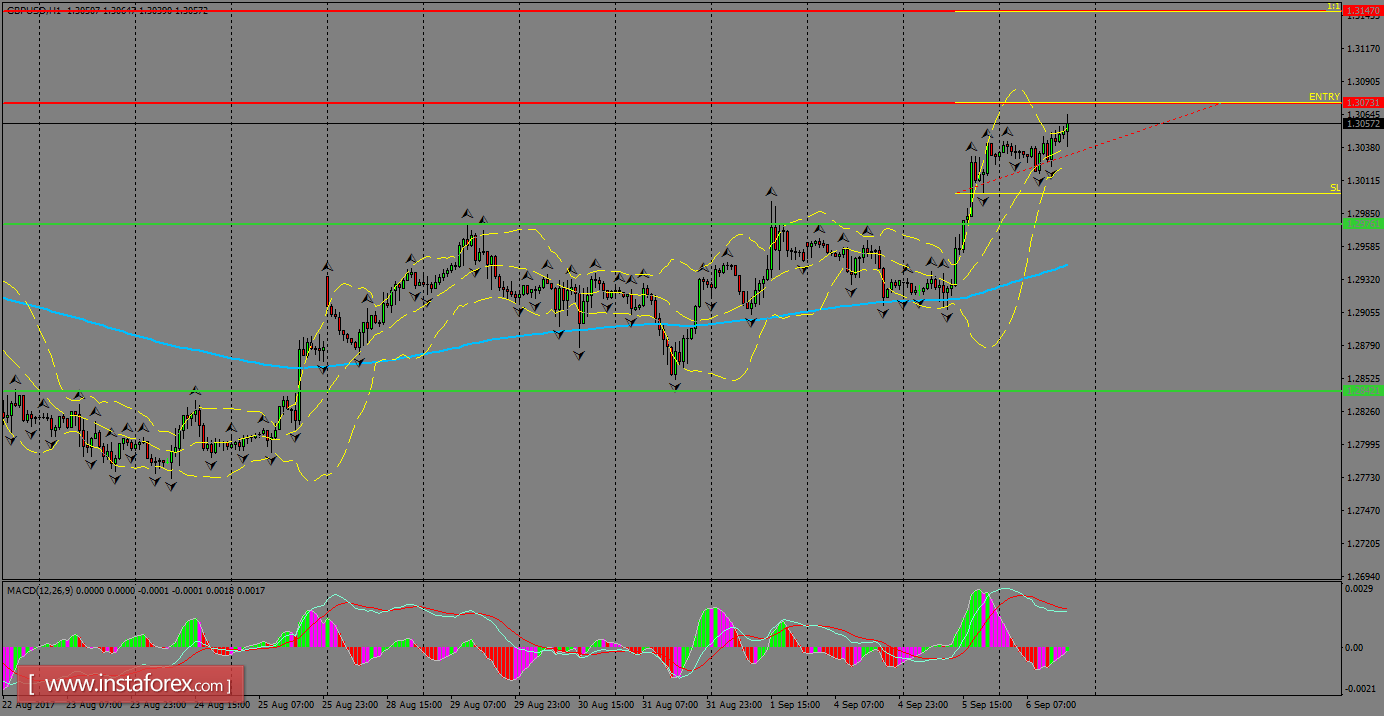
H1 chart's resistance levels: 1.3073 / 1.3147
H1 chart's support levels: 1.2976 / 1.2842
Trading recommendations for today: Based on the H1 chart, buy (long) orders only if the GBP/USD pair breaks a bullish candlestick; the resistance level is at 1.3073, take profit is at 1.3147 and stop loss is at 1.3000.