 English
  Русский
 Bahasa Indonesia
 Bahasa Malay
 ไทย
ไทย Español
 Deutsch
 Български
 Français
 Tiếng Việt
 中文
中文 বাংলা
বাংলা हिन्दी
 Čeština
 Українська
 Română

The Dollar index remains under pressure in a clear bearish trend in the short and medium term. There are several warning signs of a possible reversal as the index is overbought.
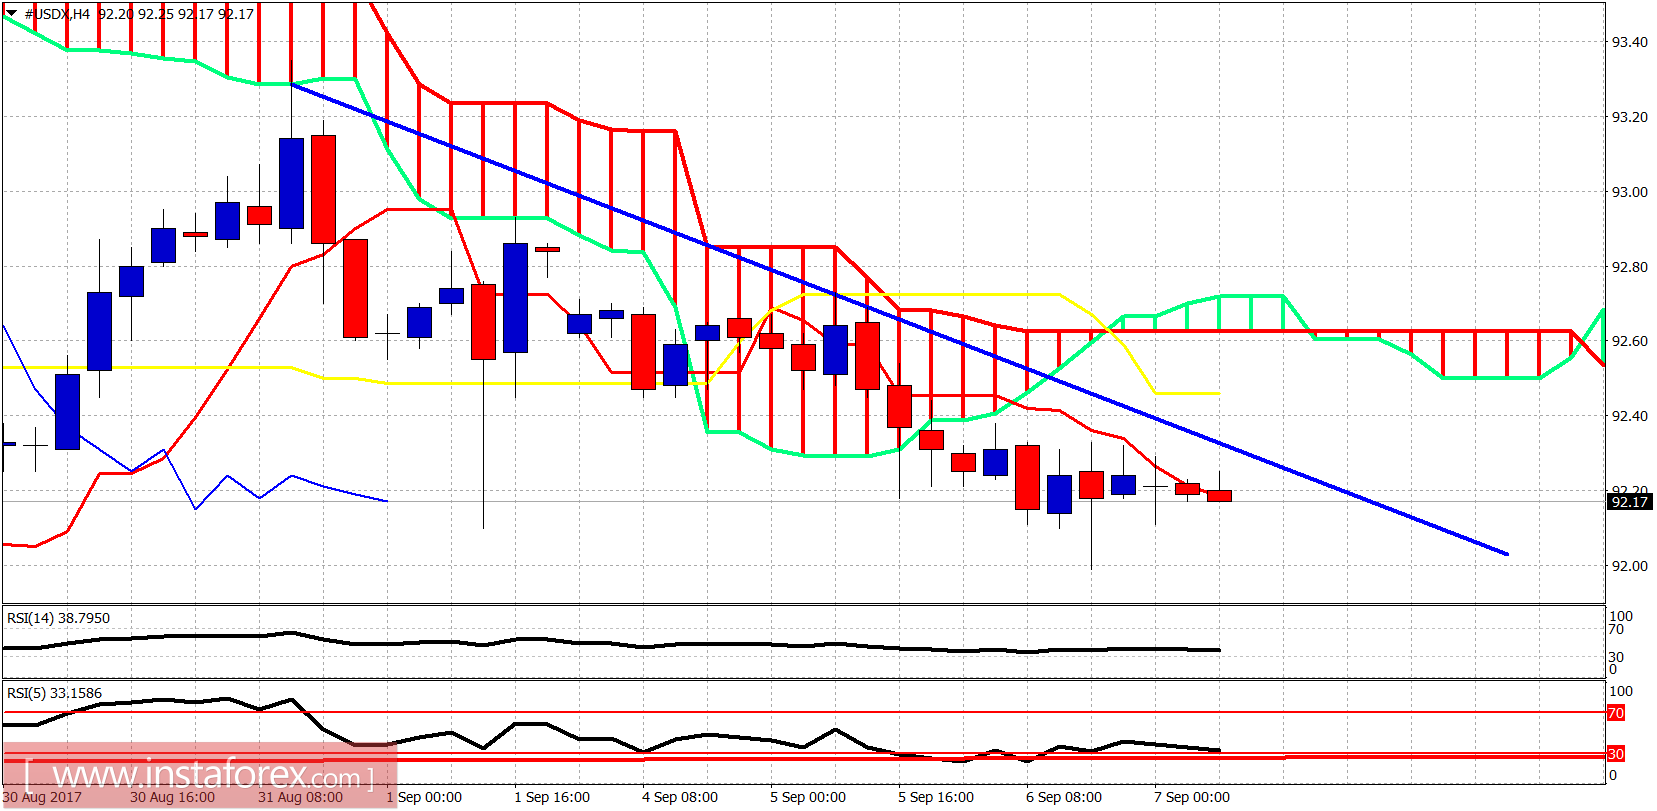
Price is below both the tenkan- and kijun-sen. Resistance is at 92.30 and the next is at 92.60. Support is at 92 and the next at 91.60. As long as price is below 92.60 we remain in a short-term bearish trend heading for new lows below 91.60.
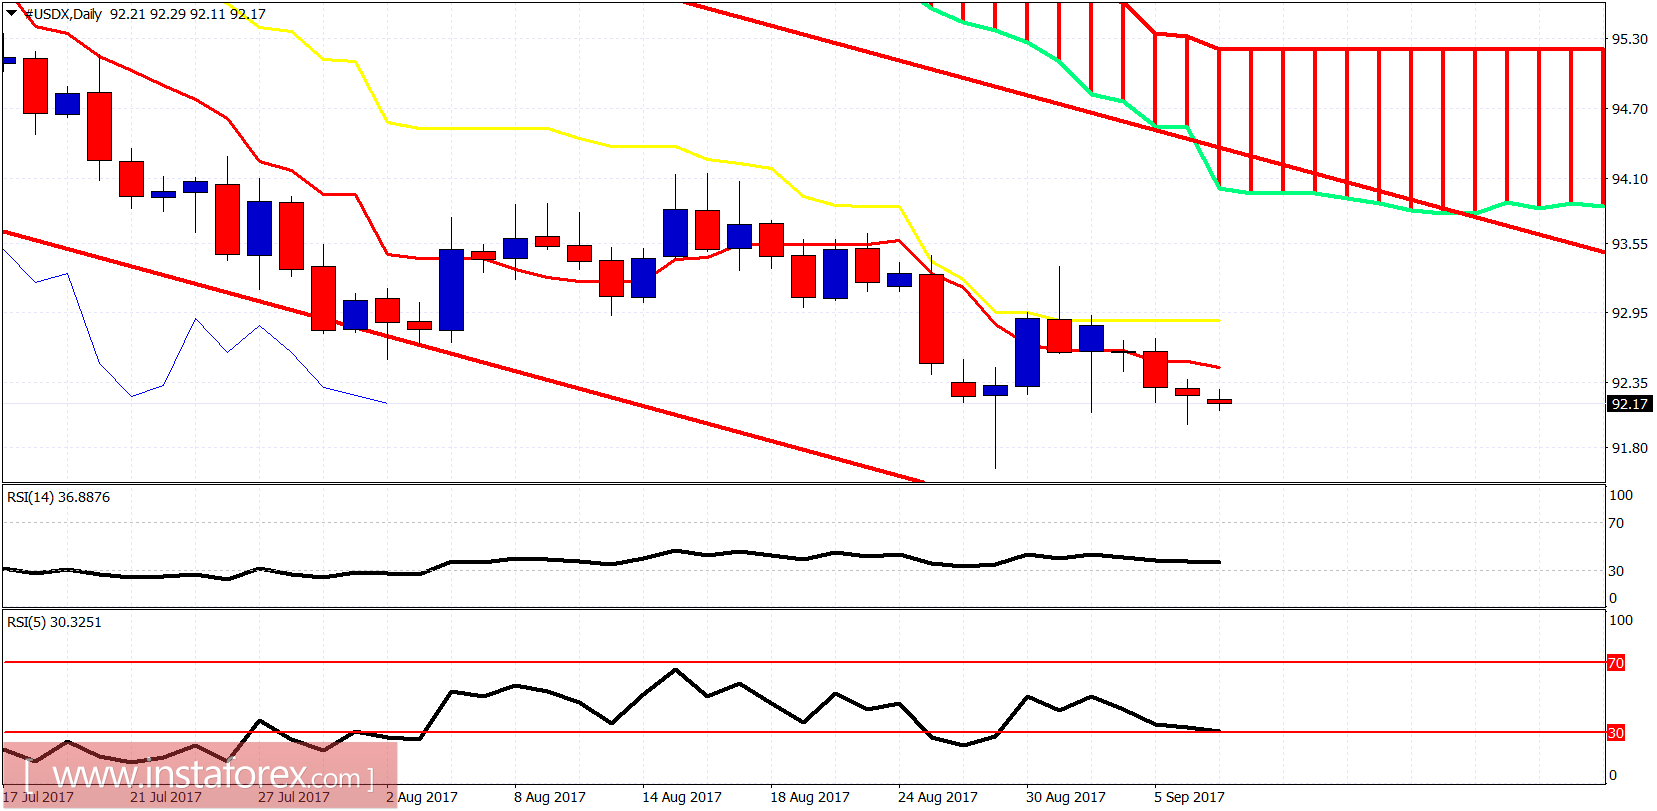
The Daily trend remains bearish. Price is below the tenkan-sen and is making lower lows and lower highs. 92.90 is the resistance level bulls need to break in order for the index to move towards 94. The oscillators justify an upward reversal but we have no confirmation or sign of it starting yet.