 English
  Русский
 Bahasa Indonesia
 Bahasa Malay
 ไทย
ไทย Español
 Deutsch
 Български
 Français
 Tiếng Việt
 中文
中文 বাংলা
বাংলা हिन्दी
 Čeština
 Українська
 Română

Greenback's weakness is still the main driver in the currencies' baskets, as the index is doing a breakout below August 29th lows and it looks like we can see a downside continuation towards the 90.30 level, where bulls could attempt a recovery to correct the recent declines. The 200 SMA on H1 chart is still pointing to the downside and recoveries' attempts should be limited by such indicator.
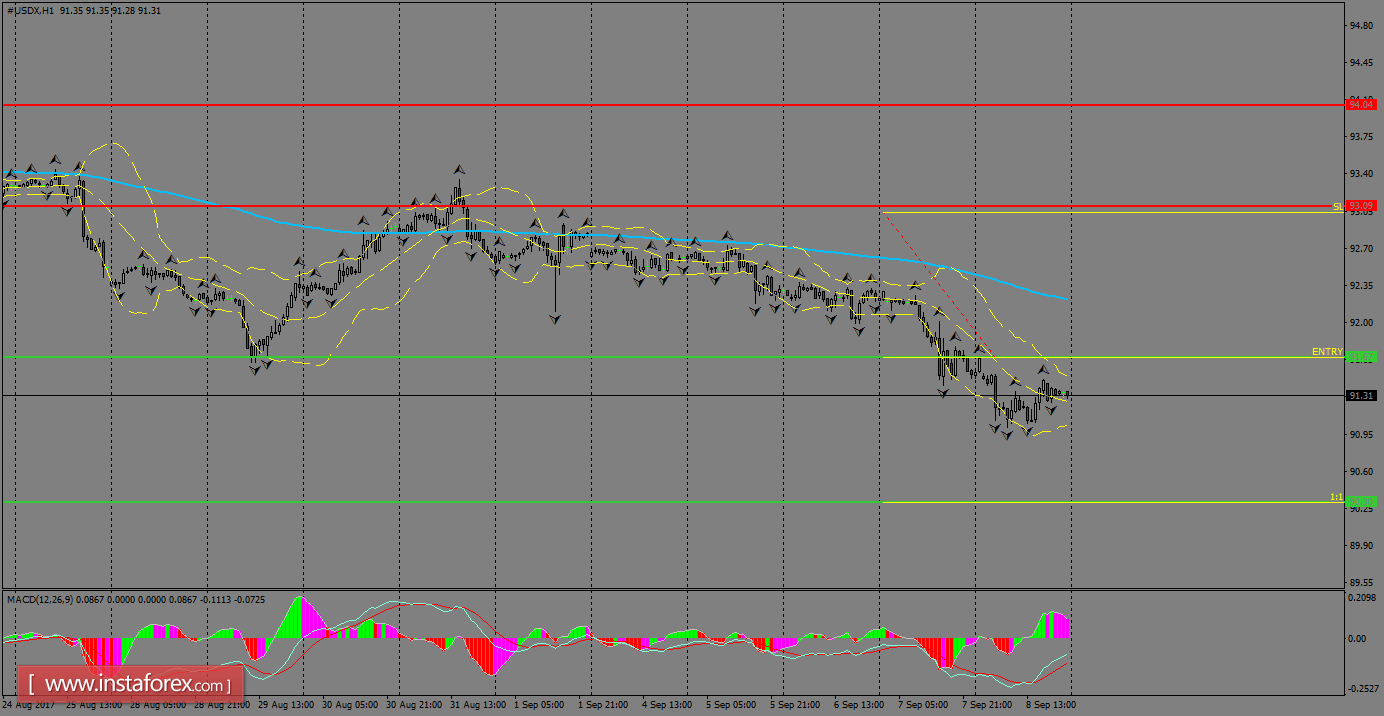
H1 chart's resistance levels: 93.09 / 94.04
H1 chart's support levels: 91.67 / 90.30
Trading recommendations for today: Based on the H1 chart, place sell (short) orders only if the USD Index breaks with a bearish candlestick; the support level is at 91.67, take profit is at 90.30 and stop loss is at 93.04.