Gold price opened with a gap down today. Trend remains bullish. Price can find support at $1,330-$1,340 area. Gold price is expected to continue its bullish trend higher.
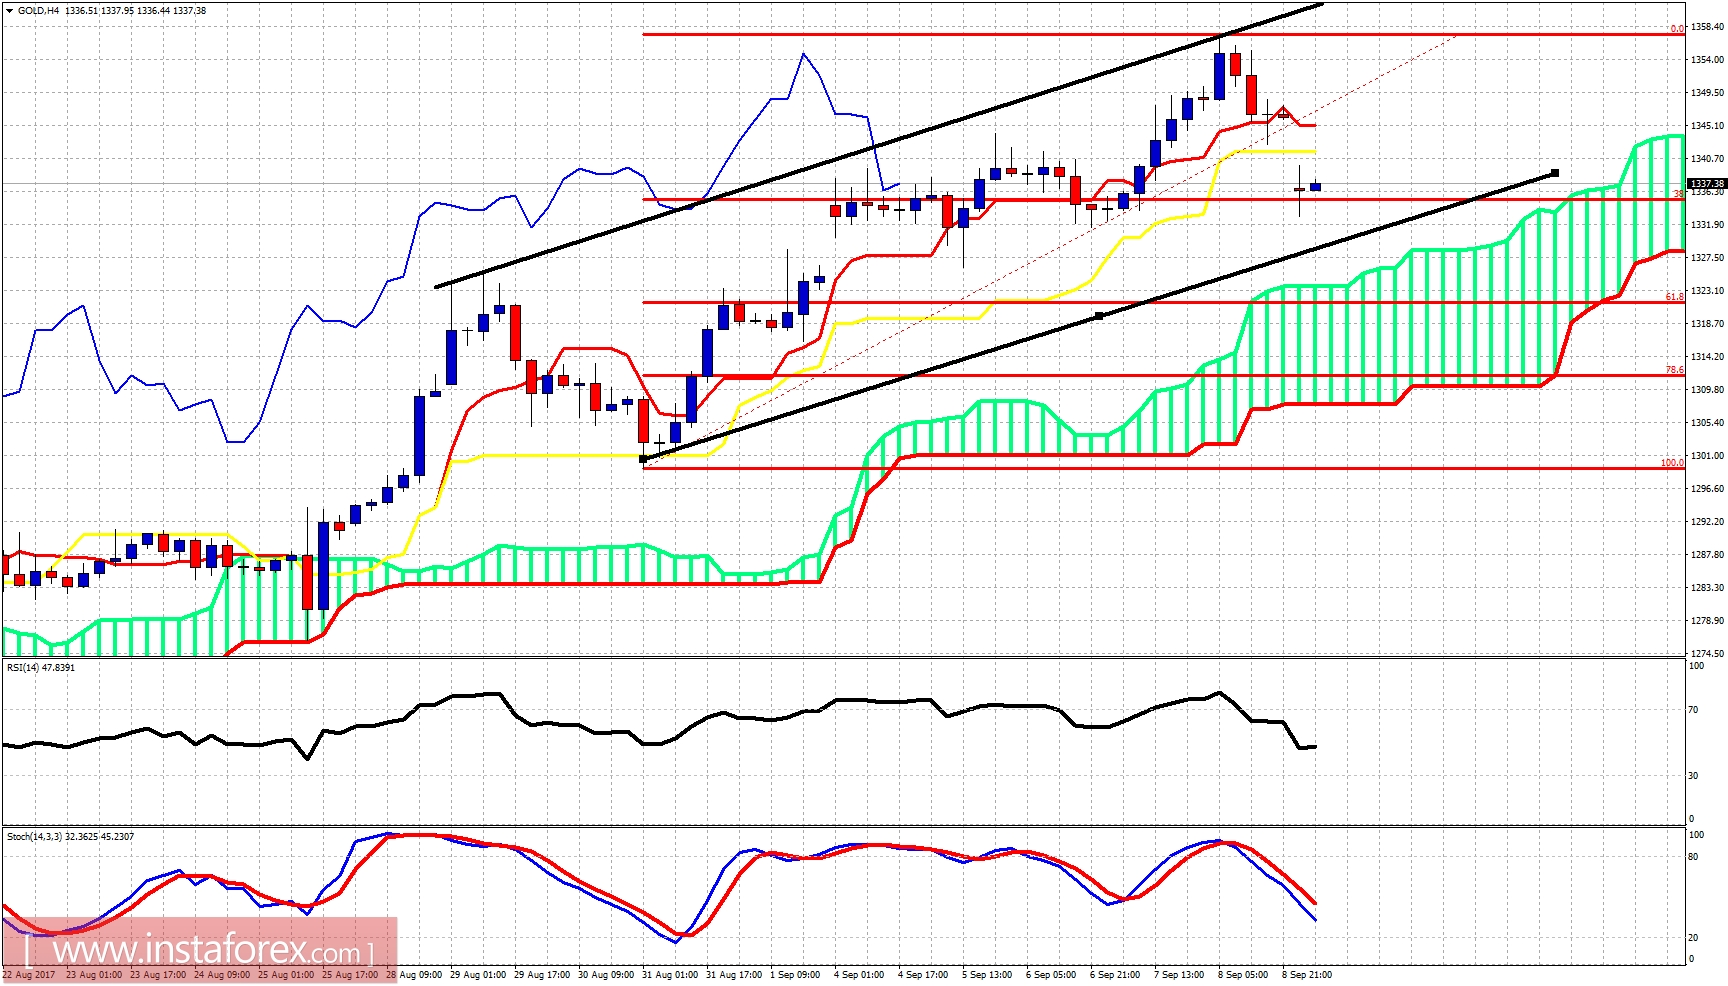
Black lines - bullish channel
Gold price has reached the 38% Fibonacci retracement support. We could see price move a bit lower towards the lower channel boundary or the Ichimoku cloud support at $1,330, This would be a buying opportunity. I remain bullish and expect Gold price to reverse to the upside soon.
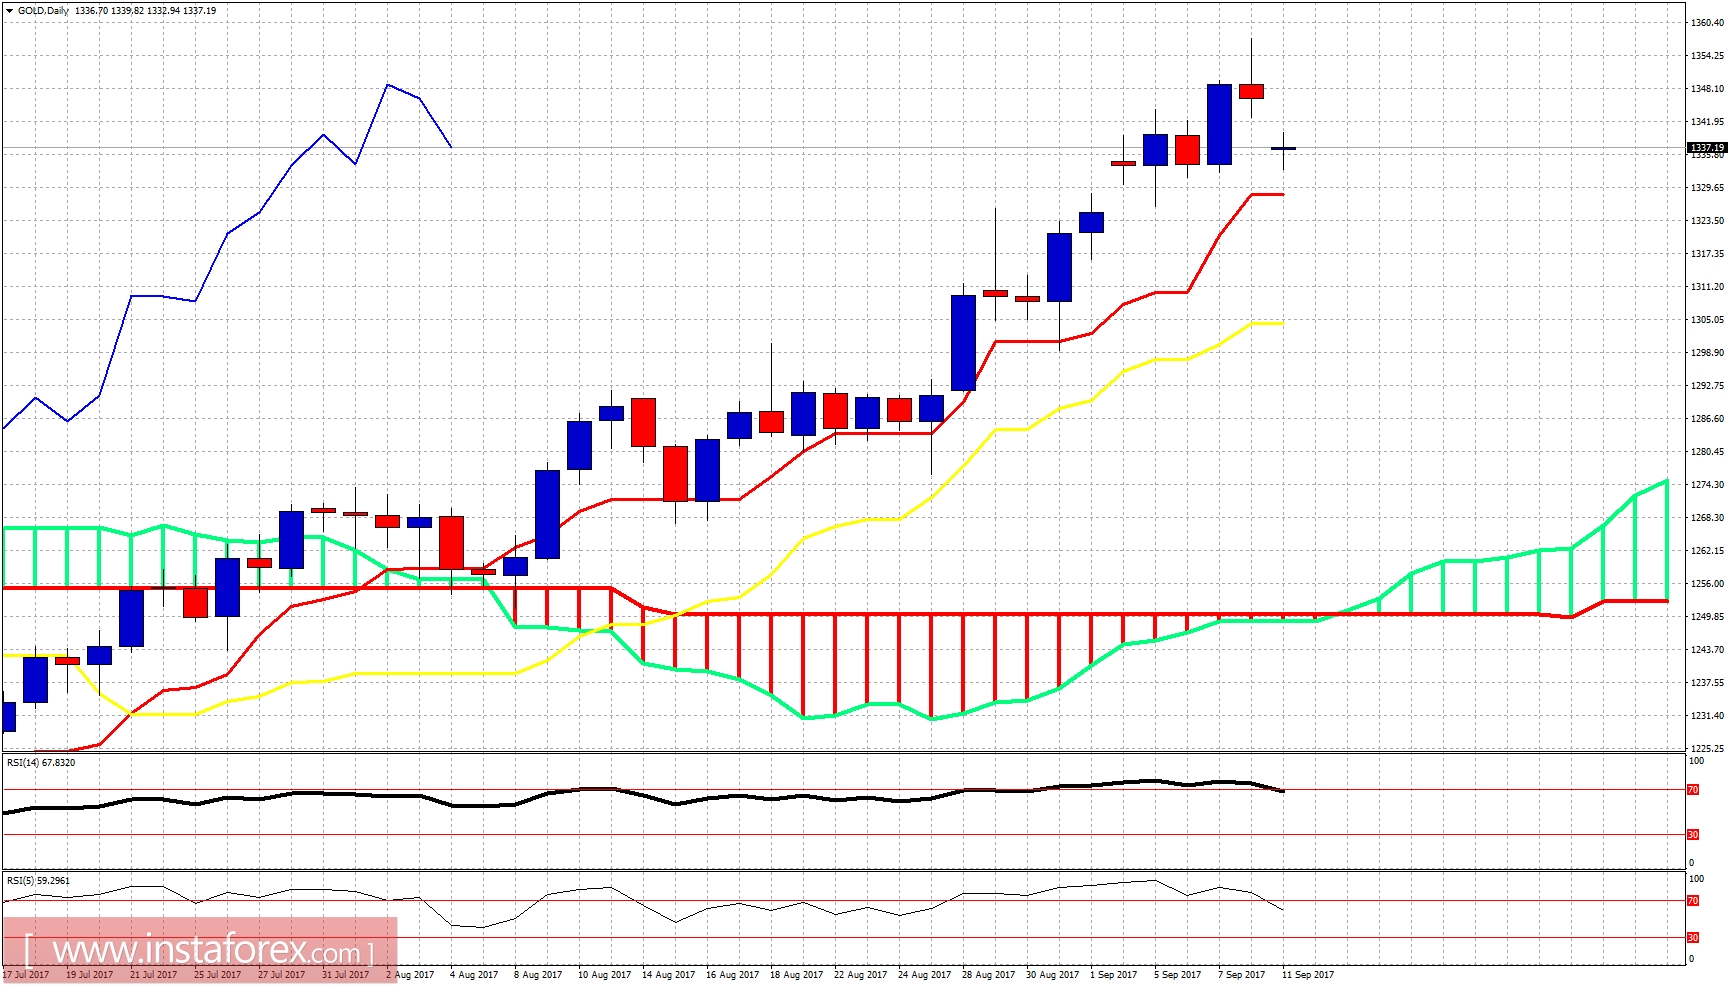
On a daily basis, Gold price is making higher highs and higher lows. Support is at $1.330-$1,300 area. Trend is bullish in ichimoku cloud terms as well. The oscillators are turning downwards from overbought levels but we have no divergence. This implies that price should make new highs after the pullback is over.
*The market analysis posted here is meant to increase your awareness, but not to give instructions to make a trade
 English
  Русский
 Bahasa Indonesia
 Bahasa Malay
 ไทย
ไทย Español
 Deutsch
 Български
 Français
 Tiếng Việt
 中文
中文 বাংলা
বাংলা हिन्दी
 Čeština
 Українська
 Română
