 English
  Русский
 Bahasa Indonesia
 Bahasa Malay
 ไทย
ไทย Español
 Deutsch
 Български
 Français
 Tiếng Việt
 中文
中文 বাংলা
বাংলা हिन्दी
 Čeština
 Українська
 Română

GBP/USD is forming a double top pattern around the resistance zone of 1.3213. We could be in front of a major correction of the pair, at least towards the support level of 1.3113, where buyers might be waiting for another momentum in the Cable. To the downside, the major target is still placed at the 1.3016, which is below the 200 SMA on H1 chart.
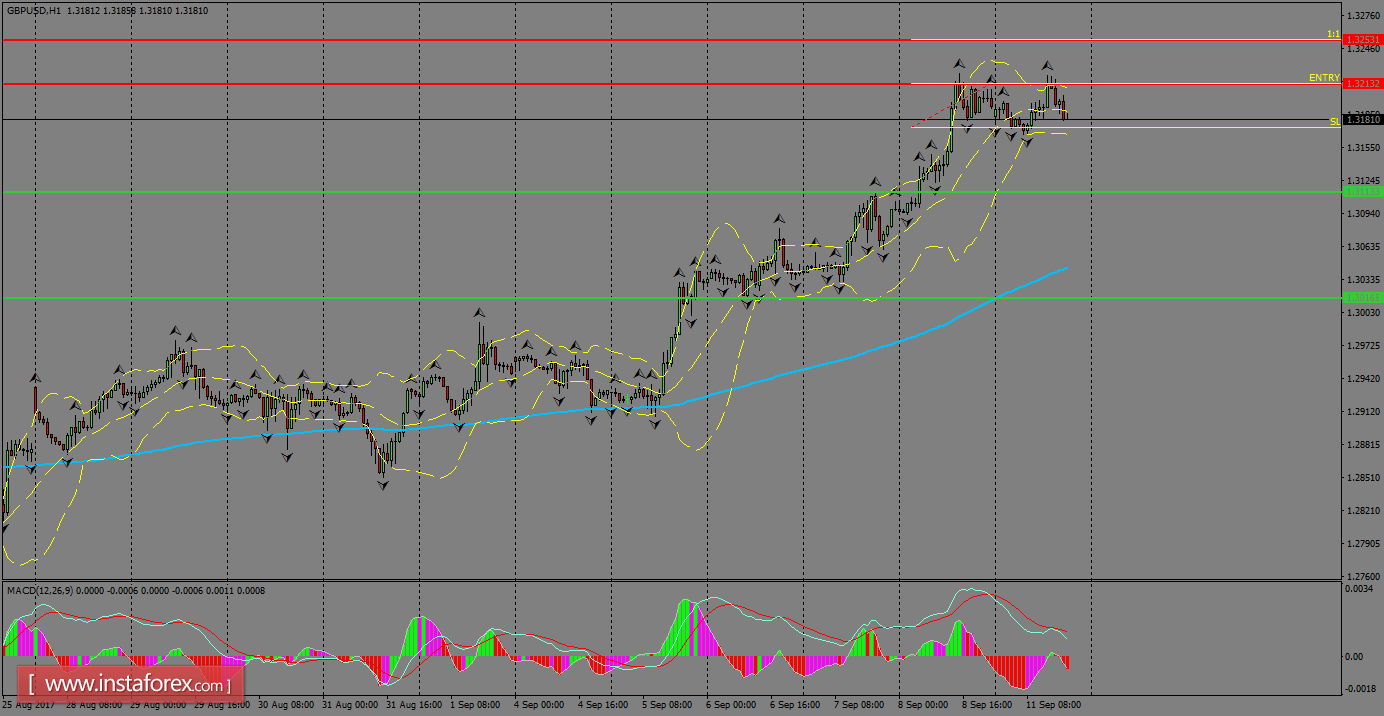
H1 chart's resistance levels: 1.3213 / 1.3253
H1 chart's support levels: 1.3113 / 1.3016
Trading recommendations for today: Based on the H1 chart, buy (long) orders only if the GBP/USD pair breaks a bullish candlestick; the resistance level is at 1.3213, take profit is at 1.3253 and stop loss is at 1.3173.