Gold price has reached the Kumo (cloud) support on the 4-hour chart. This support area is expected to hold and provide a new upward move in Gold prices to new highs. I'm buying pull backs in Gold.
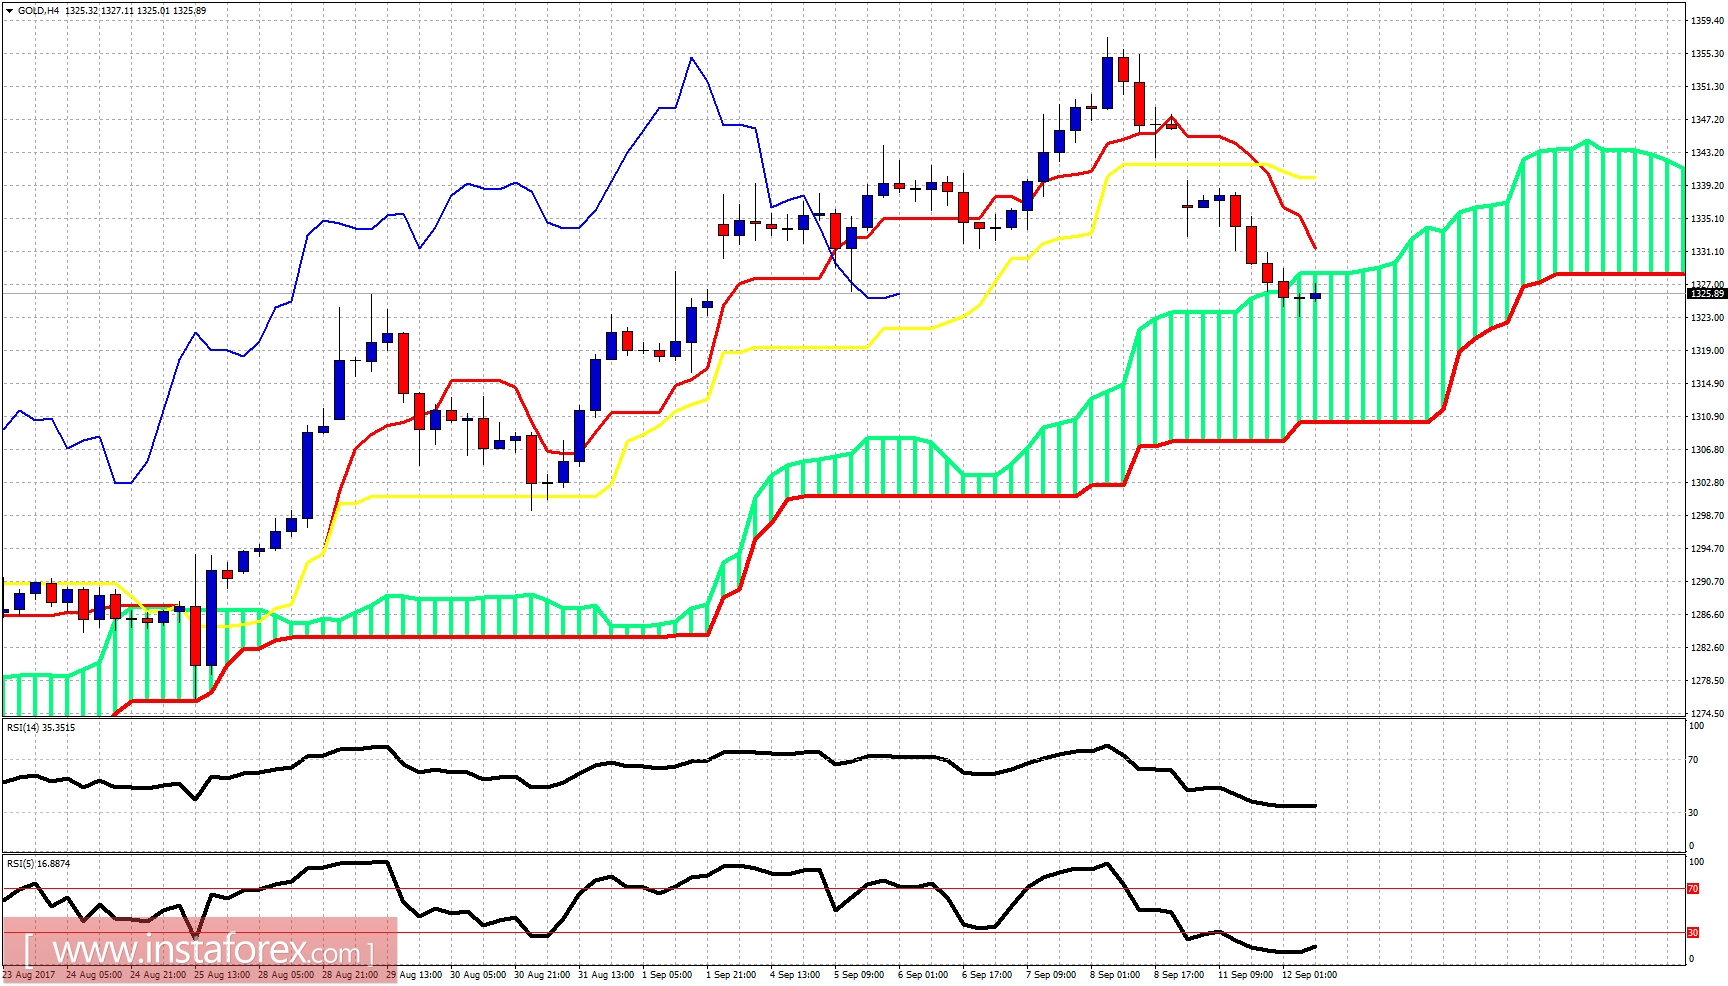
Gold price is trading below both the tenkan- and the kijun-sen indicators. But price has stopped the decline at the 4-hour Kumo while the RSI (5) is oversold and showing signs of reversal of short-term trend. This is not the time to sell Gold but to buy more. Why? Because our longer-term view remains bullish.
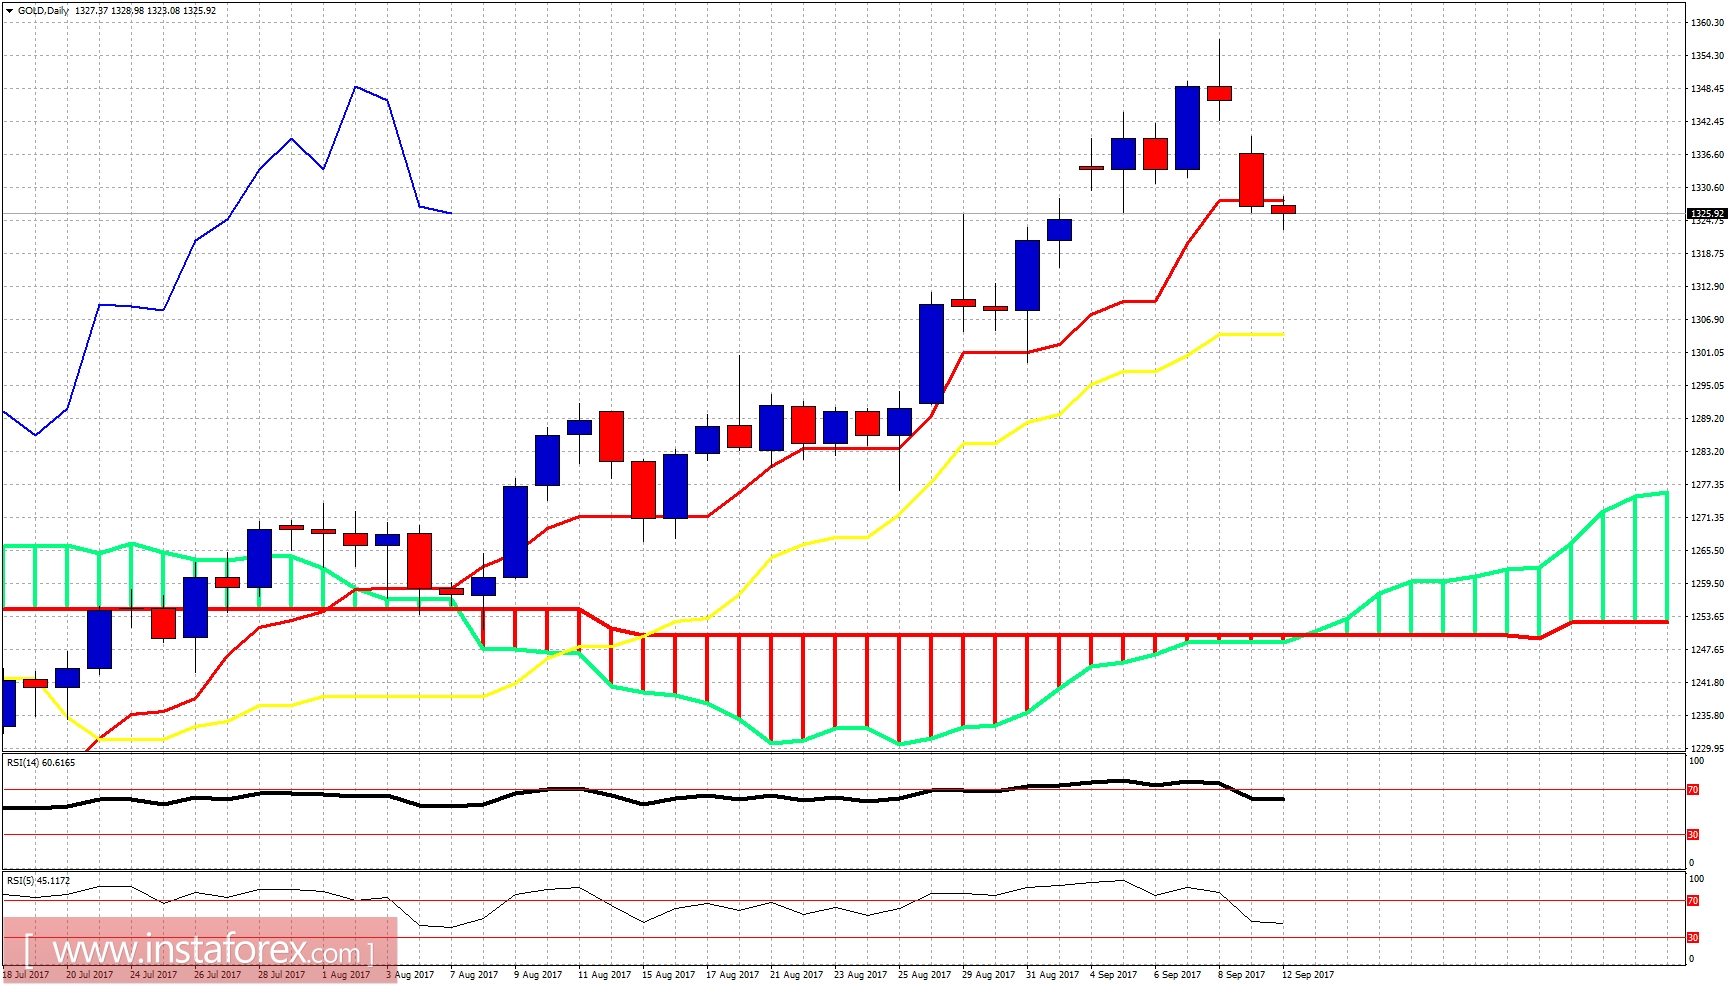
Gold price continues to make higher highs and higher lows on the daily chart. Price has just broken below the daily tenkan-sen. Support now can be found at the kijun-sen at $1,305. I see very slim chances of reaching the kijun-sen but as long as we trade below the tenkan-sen (red line indicator at $1,328.60) the short-term bearish scenario is still open. A daily close above the tenkan-sen will turn short-term trend to bullish again for a new high around $1,380.
*The market analysis posted here is meant to increase your awareness, but not to give instructions to make a trade
 English
  Русский
 Bahasa Indonesia
 Bahasa Malay
 ไทย
ไทย Español
 Deutsch
 Български
 Français
 Tiếng Việt
 中文
中文 বাংলা
বাংলা हिन्दी
 Čeština
 Українська
 Română
