English
  Русский
 Bahasa Indonesia
 Bahasa Malay
 ไทย
ไทย Español
 Deutsch
 Български
 Français
 Tiếng Việt
 中文
中文 বাংলা
বাংলা हिन्दी
 Čeština
 Українська
 Română

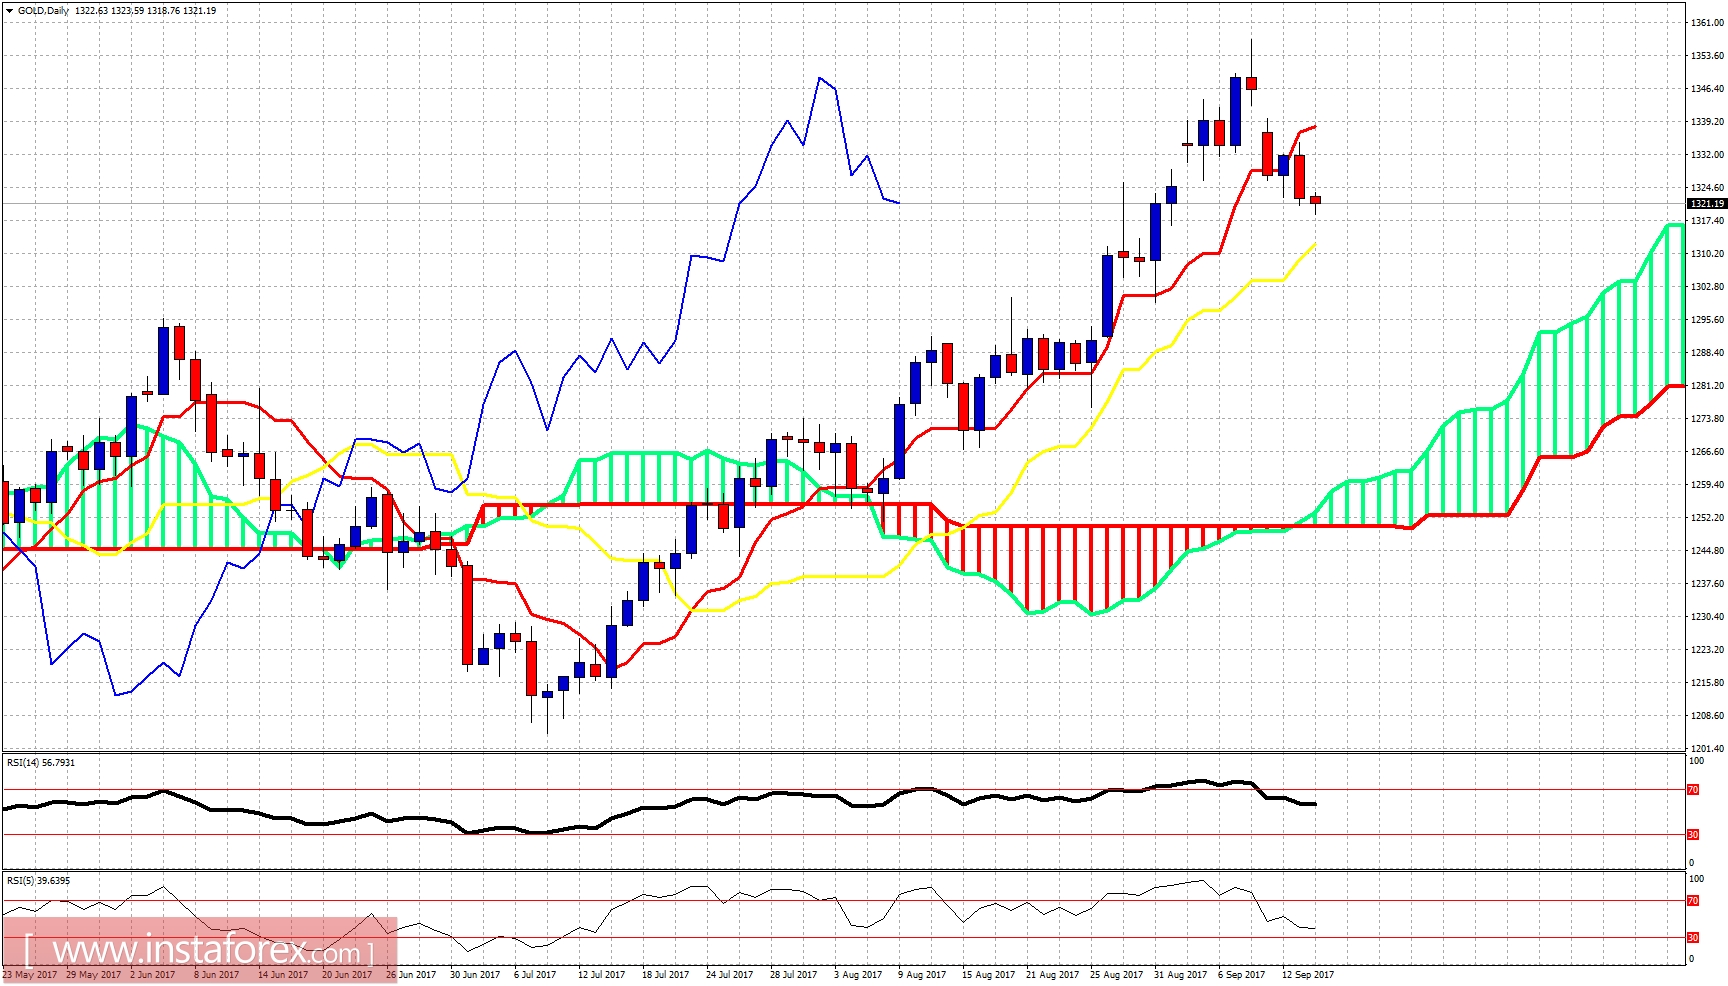
Gold price is pulling back as we expected. We warned that there were overbought signs and that Gold price would need a pull back towards $1,330-$1,320. This pull back could extend towards $1,300, however our longer-term view remains bullish and we see this as a buying opportunity.
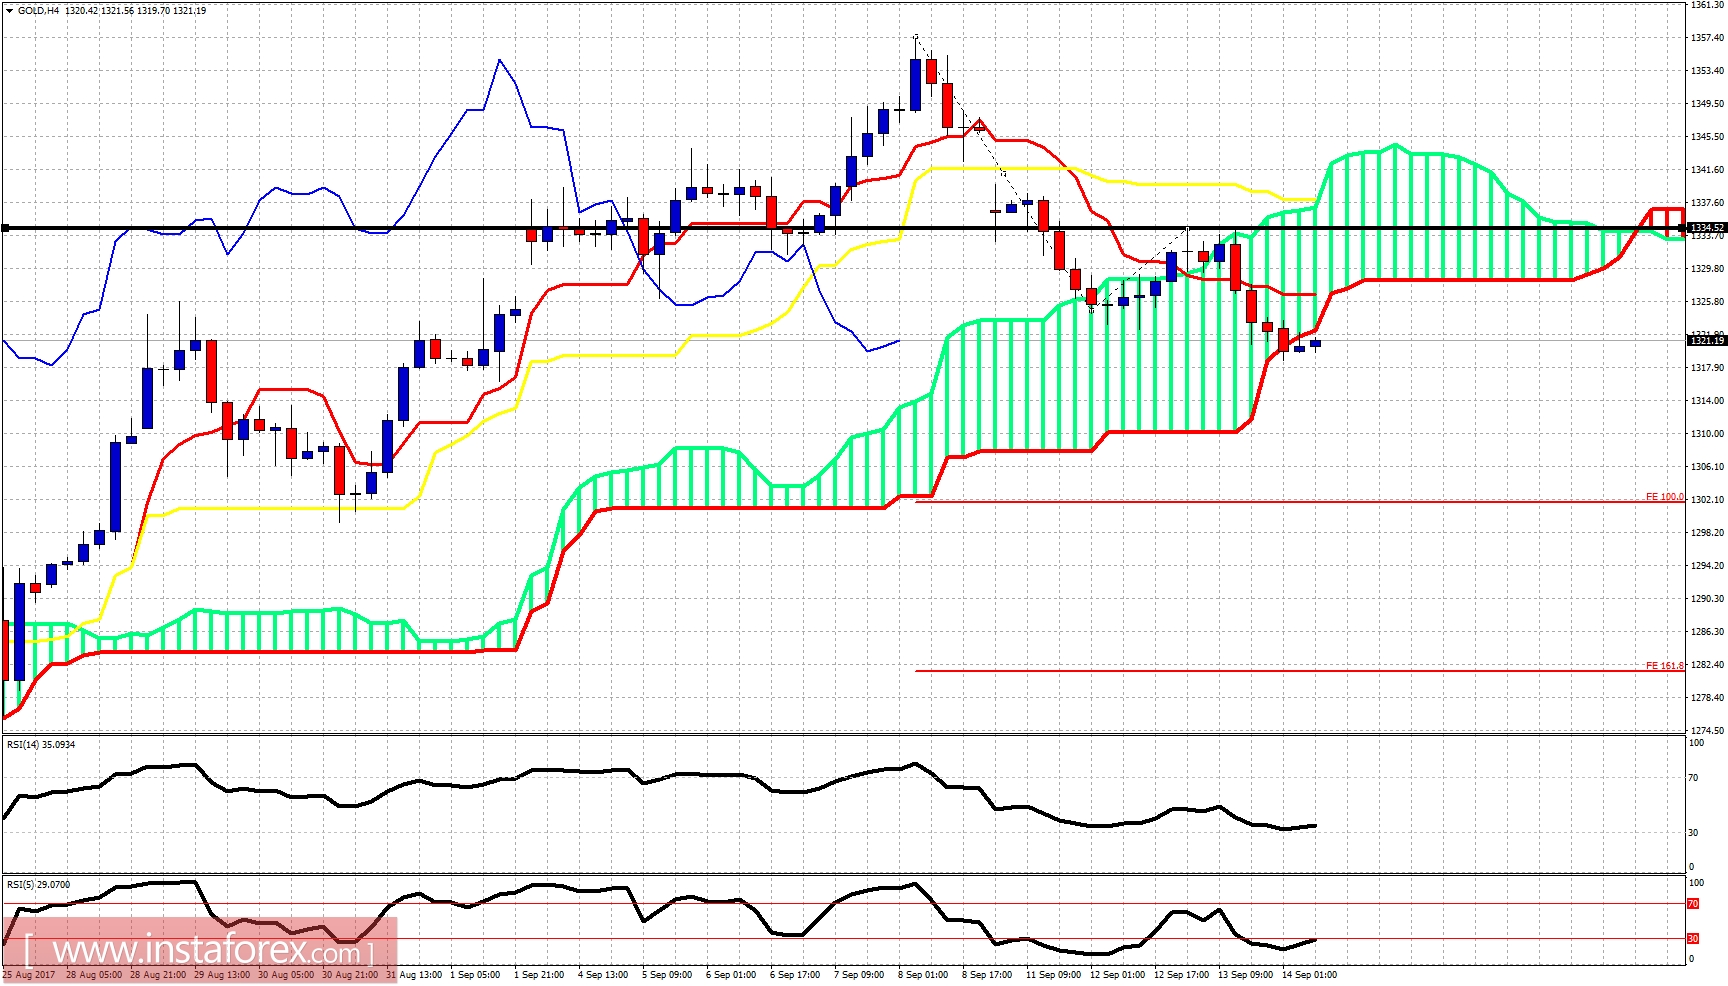
Gold price is breaking below the 4-hour Kumo support. This implies that more downside should be expected. Gold price could extend the decline lower for an equal leg down similar to the first part of the decline. The target would be at $1,302. However we should also keep an eye on the resistance and trend change level at $1,334. Breaking above it will confirm the pull back is over.